
Fig. 6.
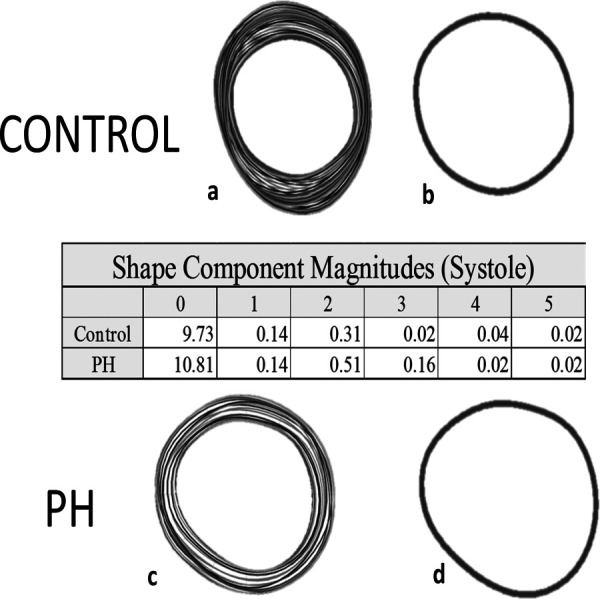
Comparison of shape component magnitudes in systole for a control subject and a PH subject with less obvious deformation illustrating sensitivity of the method to subtle shape changes. Images (a) and (c) are tracings of the endocardial borders across the entire cardiac cycle for a control (a) and PH (c) subjects. Images (b) and (d) are the endocardial border tracings in systole. The table provides quantification of the shape illustrating the sensitivity of the method.