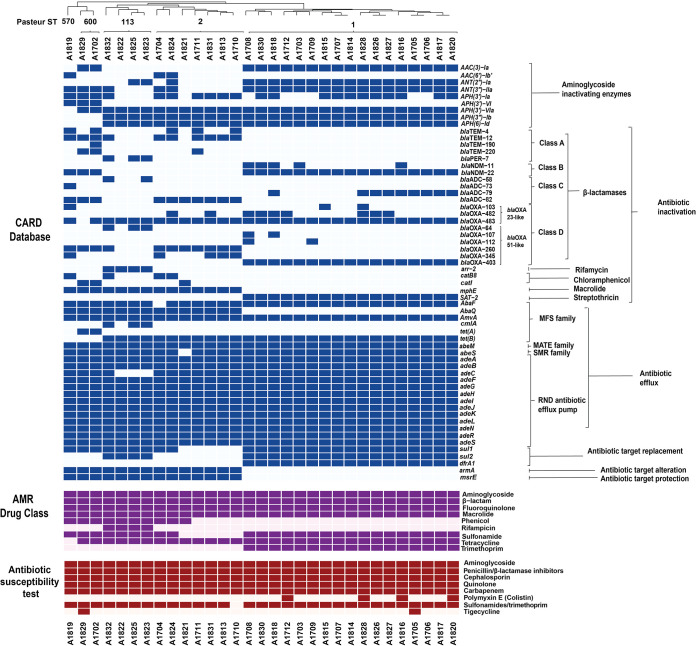
FIG 3.
Complex heat maps showing the presence or absence of each antibiotic resistance gene and antibiotic resistance drug class and the observed antibiotic susceptibility. The antibiotic resistance genes detected are shown in blue; dark blue shows the presence of the antibiotic resistance gene, while light blue indicates its absence. The antibiotic classes for which the detected genes confer resistance are shown in purple; dark purple shows expected resistance to a drug class, while light purple shows susceptibility. The phenotypic antibiotic resistance based on AST is shown in maroon; dark maroon shows resistance to the antibiotic, while light maroon shows susceptibility.

