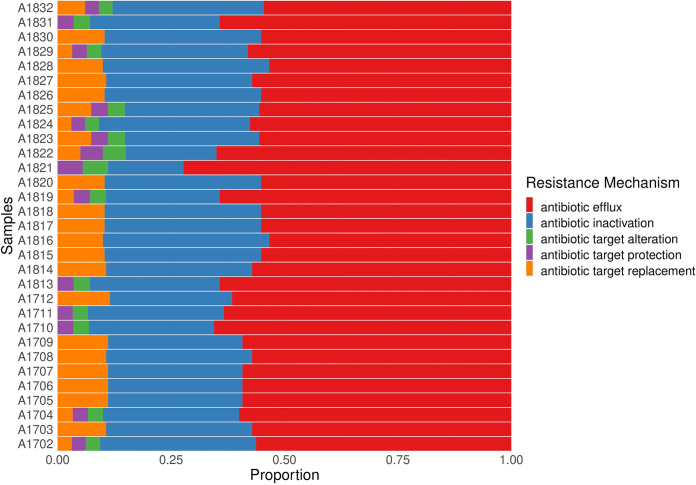
FIG 5.
Stacked bar graph showing the resistance mechanisms represented in each isolate. After grouping of the antibiotic resistance genes by mechanism. Each color represents a mechanism of resistance; red, antibiotic efflux; blue, antibiotic inactivation; green, antibiotic target alteration; purple, antibiotic target protection; orange, antibiotic target replacement.

