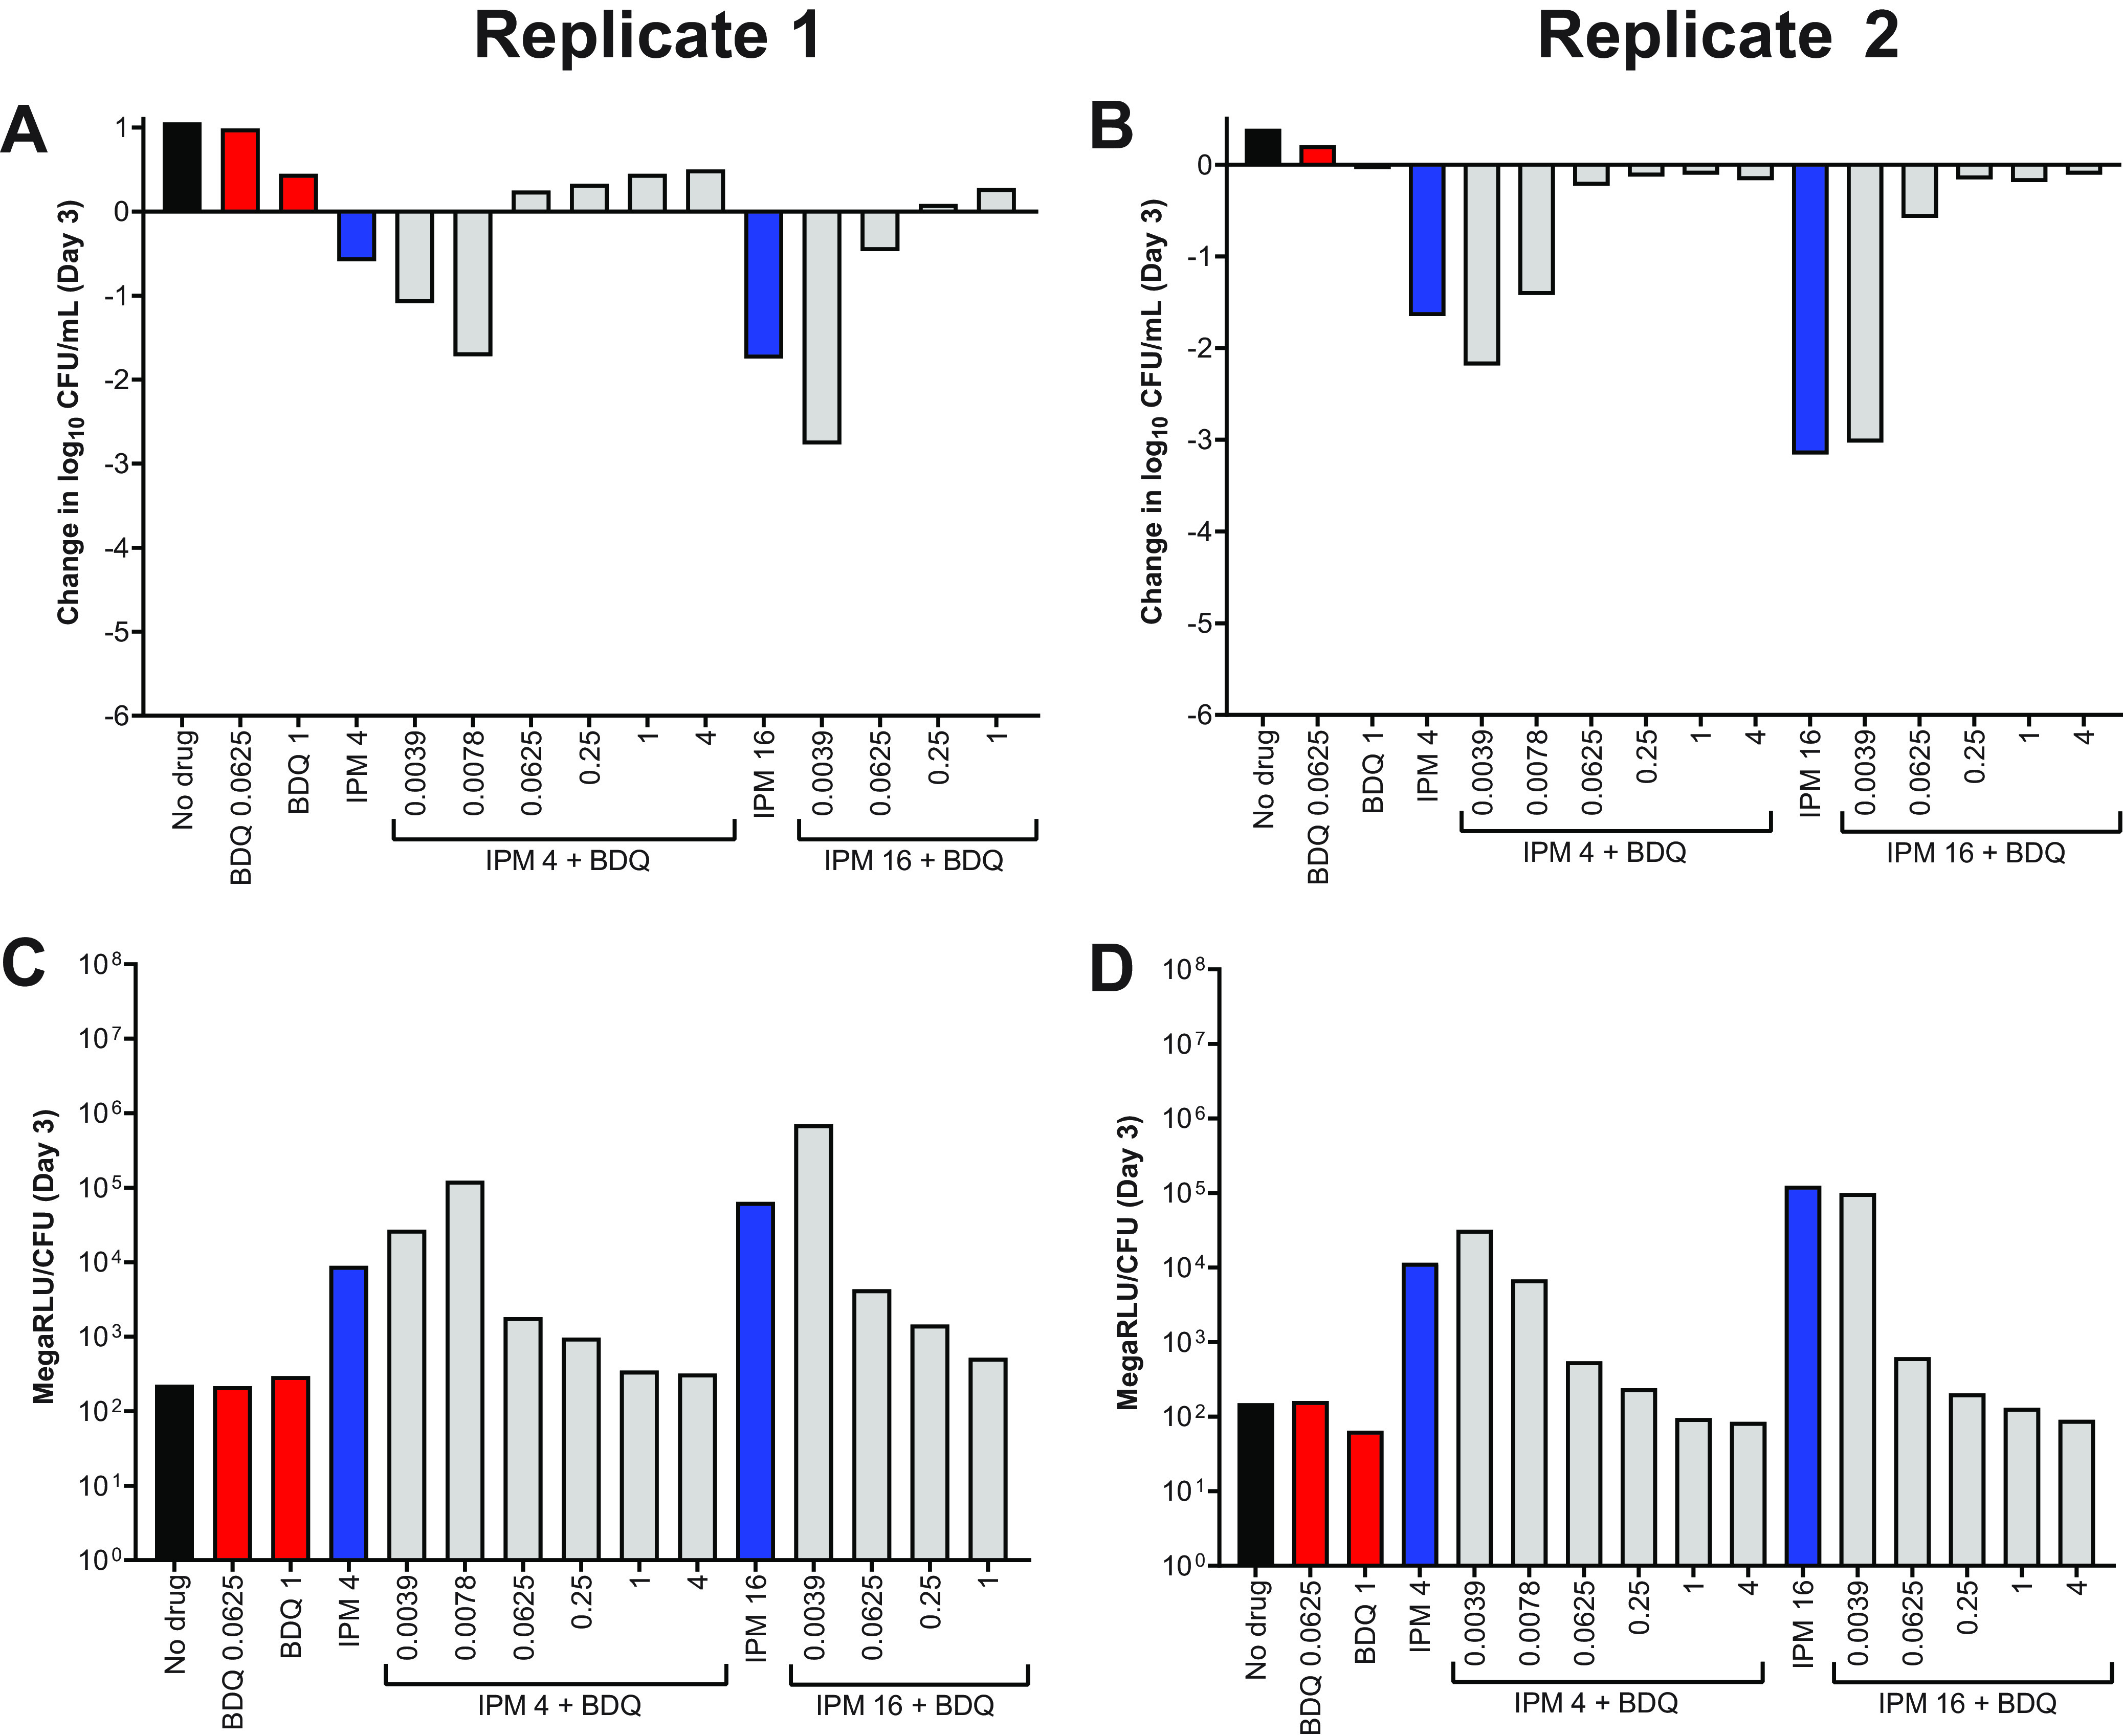
FIG 4.

Activity of bedaquiline (BDQ) and imipenem (IPM) against M. abscessus ATCC 19977 WT (A, B) and relative bacterial ATP levels (C, D), in CAMHB with 0.05% Tween 80. The change in log10 CFU/ml after 3 days of drug exposure relative to Day 0 is presented for each biological replicate in panels A and B. CFU-adjusted ATP levels, indicated by relative light units (RLU)/CFU from samples after 3 days of drug exposure, are presented for each biological replicate in panels C and D. Black bars represent the no-drug control; red bars indicate BDQ-only samples; blue bars represent IPM-only samples; and gray bars indicate IPM plus BDQ samples. The number after each drug abbreviation represents the concentration in μg/ml (for gray bars the BDQ concentration in μg/ml is presented under each bar). RLU/ml for all samples (not adjusted for CFU) are presented in Fig. S3. The Day 0 bacterial concentration for panels A and B was 6.25 and 7.03 log10 CFU/ml, respectively. CFU and RLU values are provided in Table S6.
