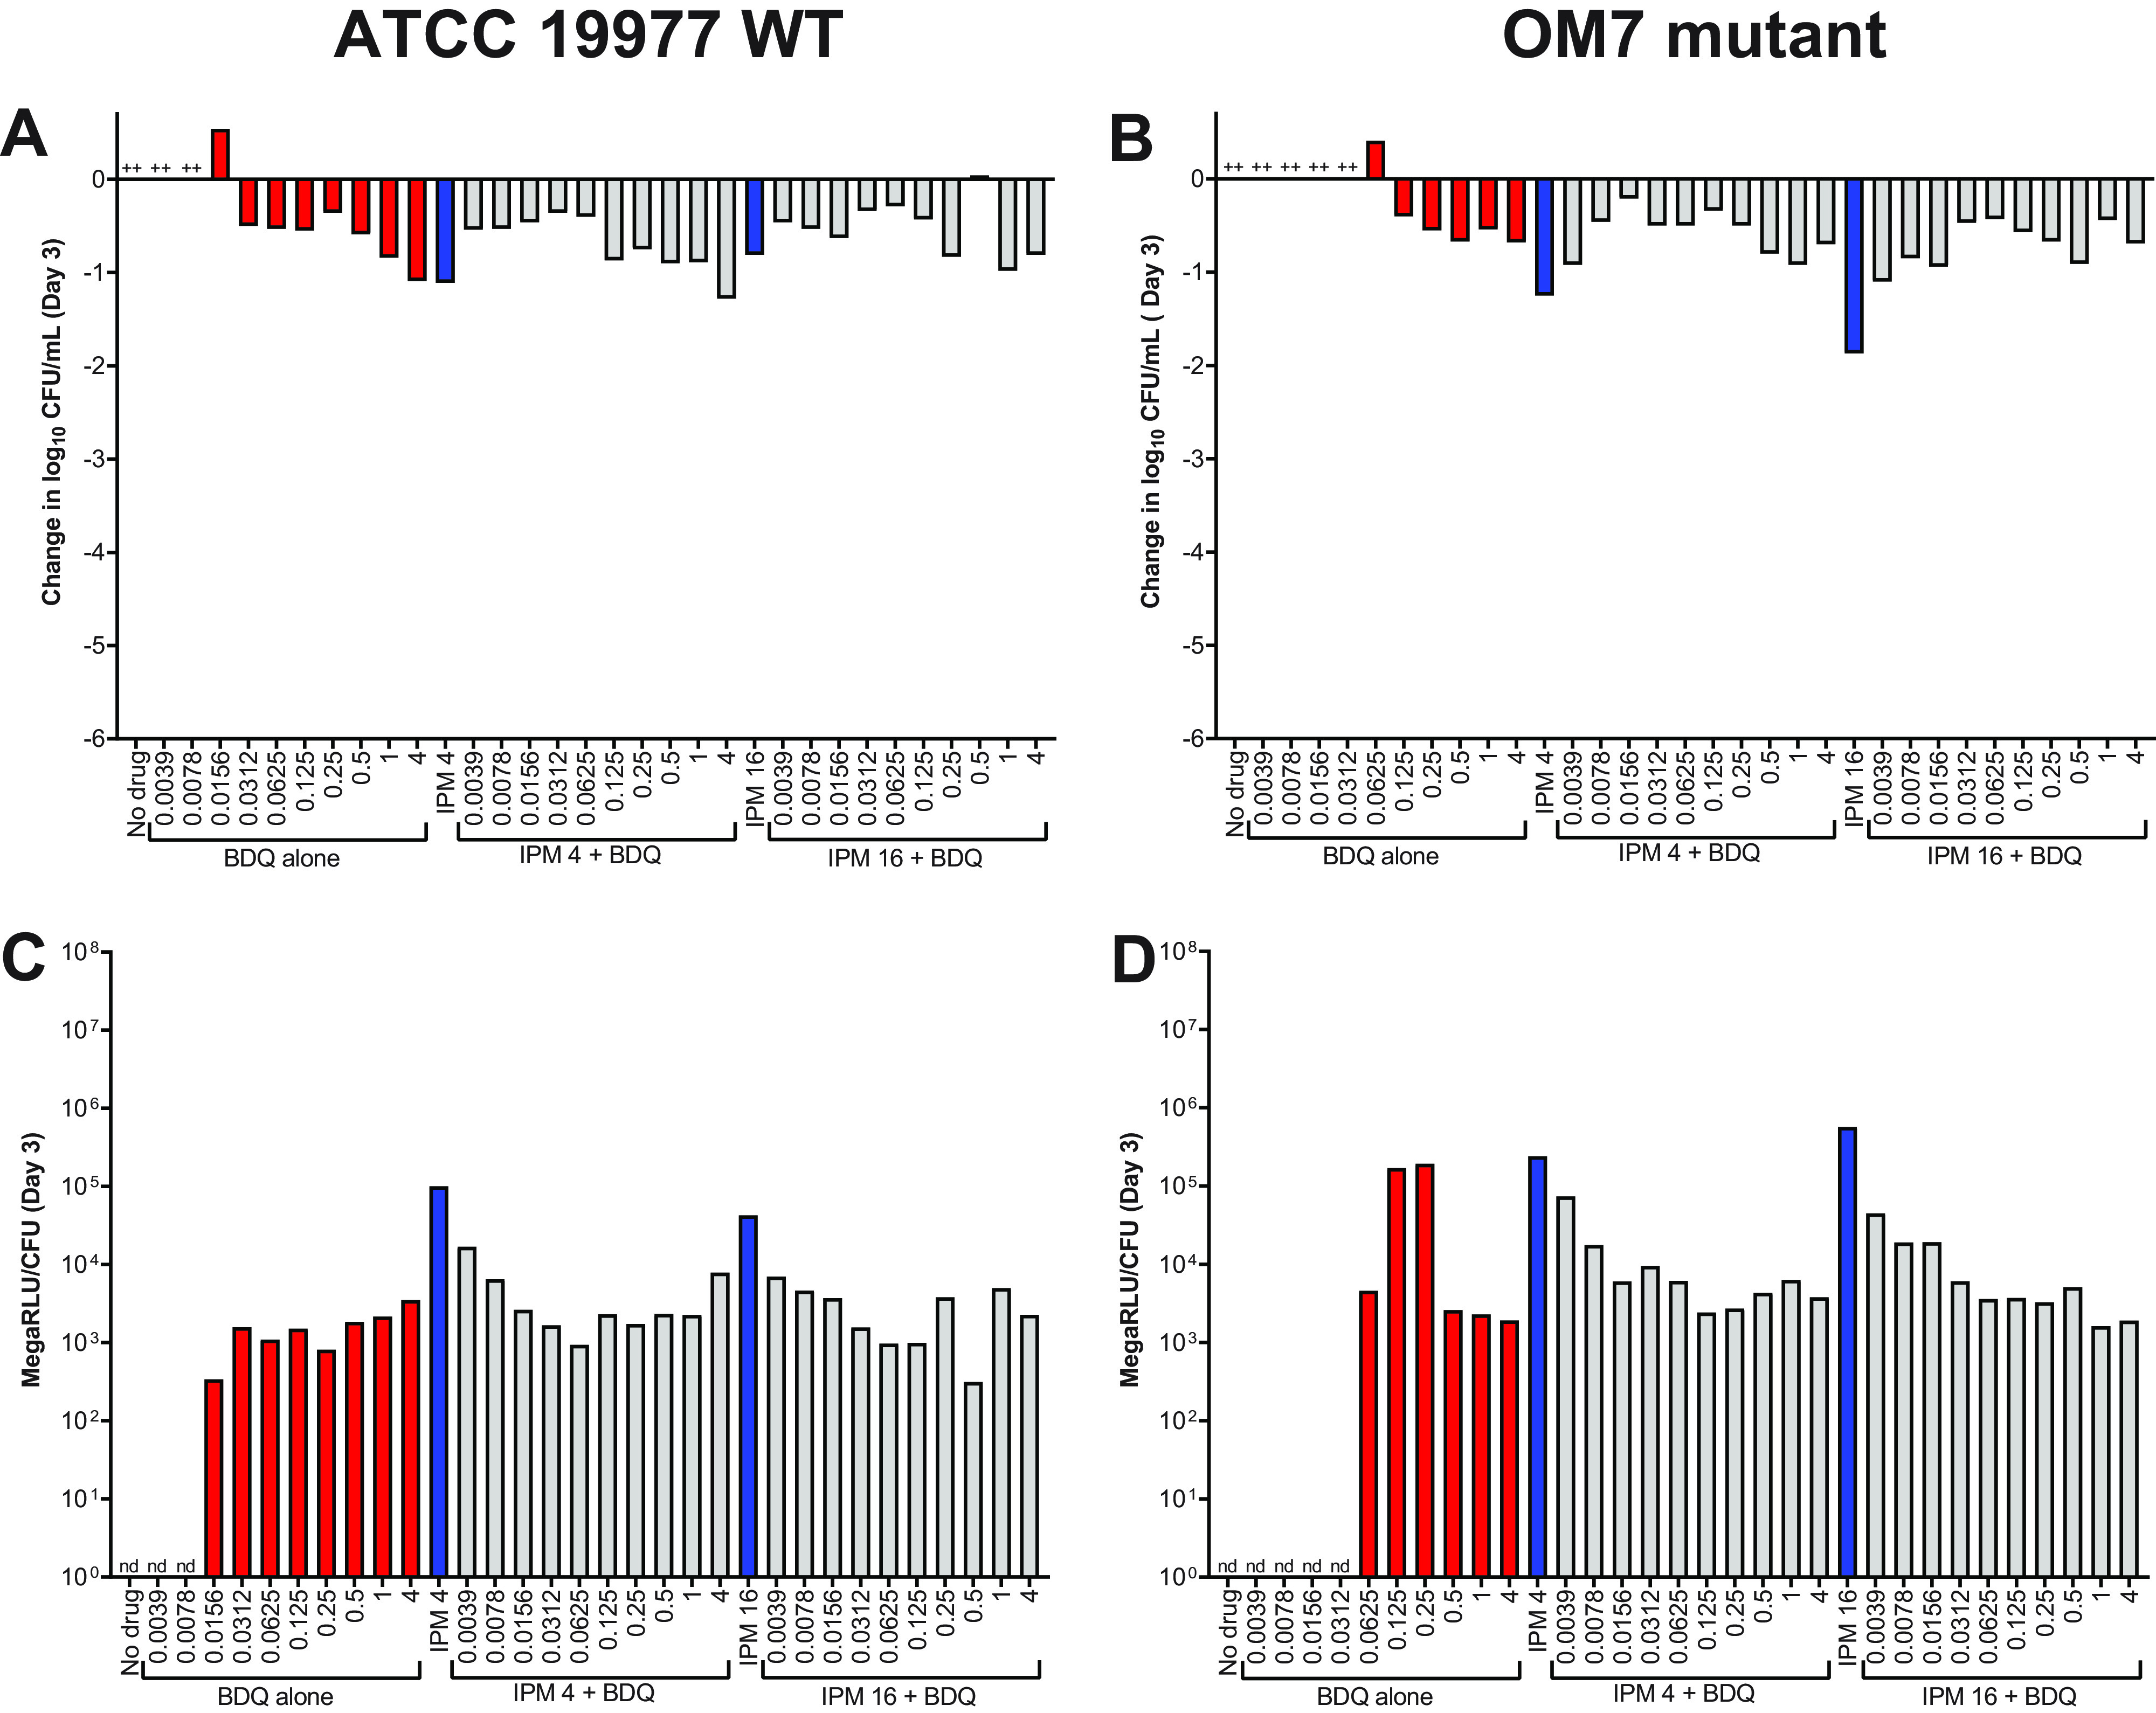
FIG 6.

Activity of bedaquiline (BDQ) and imipenem (IPM) against M. abscessus ATCC 19977 WT (A) and OM7 mutant (B), with relative bacterial ATP levels (C, D), in CAMHB without Tween 80. The changes in log10 CFU/ml after 3 days of drug exposure relative to Day 0 are presented in panels A and B; CFU-adjusted ATP levels, indicated by relative light units (RLU)/CFU from samples after 3 days of drug exposure, are presented in panels C and D. Red bars indicate BDQ-only samples; blue bars represent IPM-only samples, and gray bars indicate IPM + BDQ samples. The number after the IPM abbreviation represents the concentration in μg/ml; for red and gray bars, the BDQ concentration in μg/ml is under each bar. ++ indicates that the bacteria overgrew and clumped, precluding CFU quantification. nd indicates not determined (due to lack of CFU count data). RLU/ml for all samples (not adjusted for CFU) are presented in Fig. S5. The Day 0 bacterial concentration for panels A and B was 5.62 and 5.70 log10 CFU/ml, respectively. CFU and RLU values are provided in Table S8.
