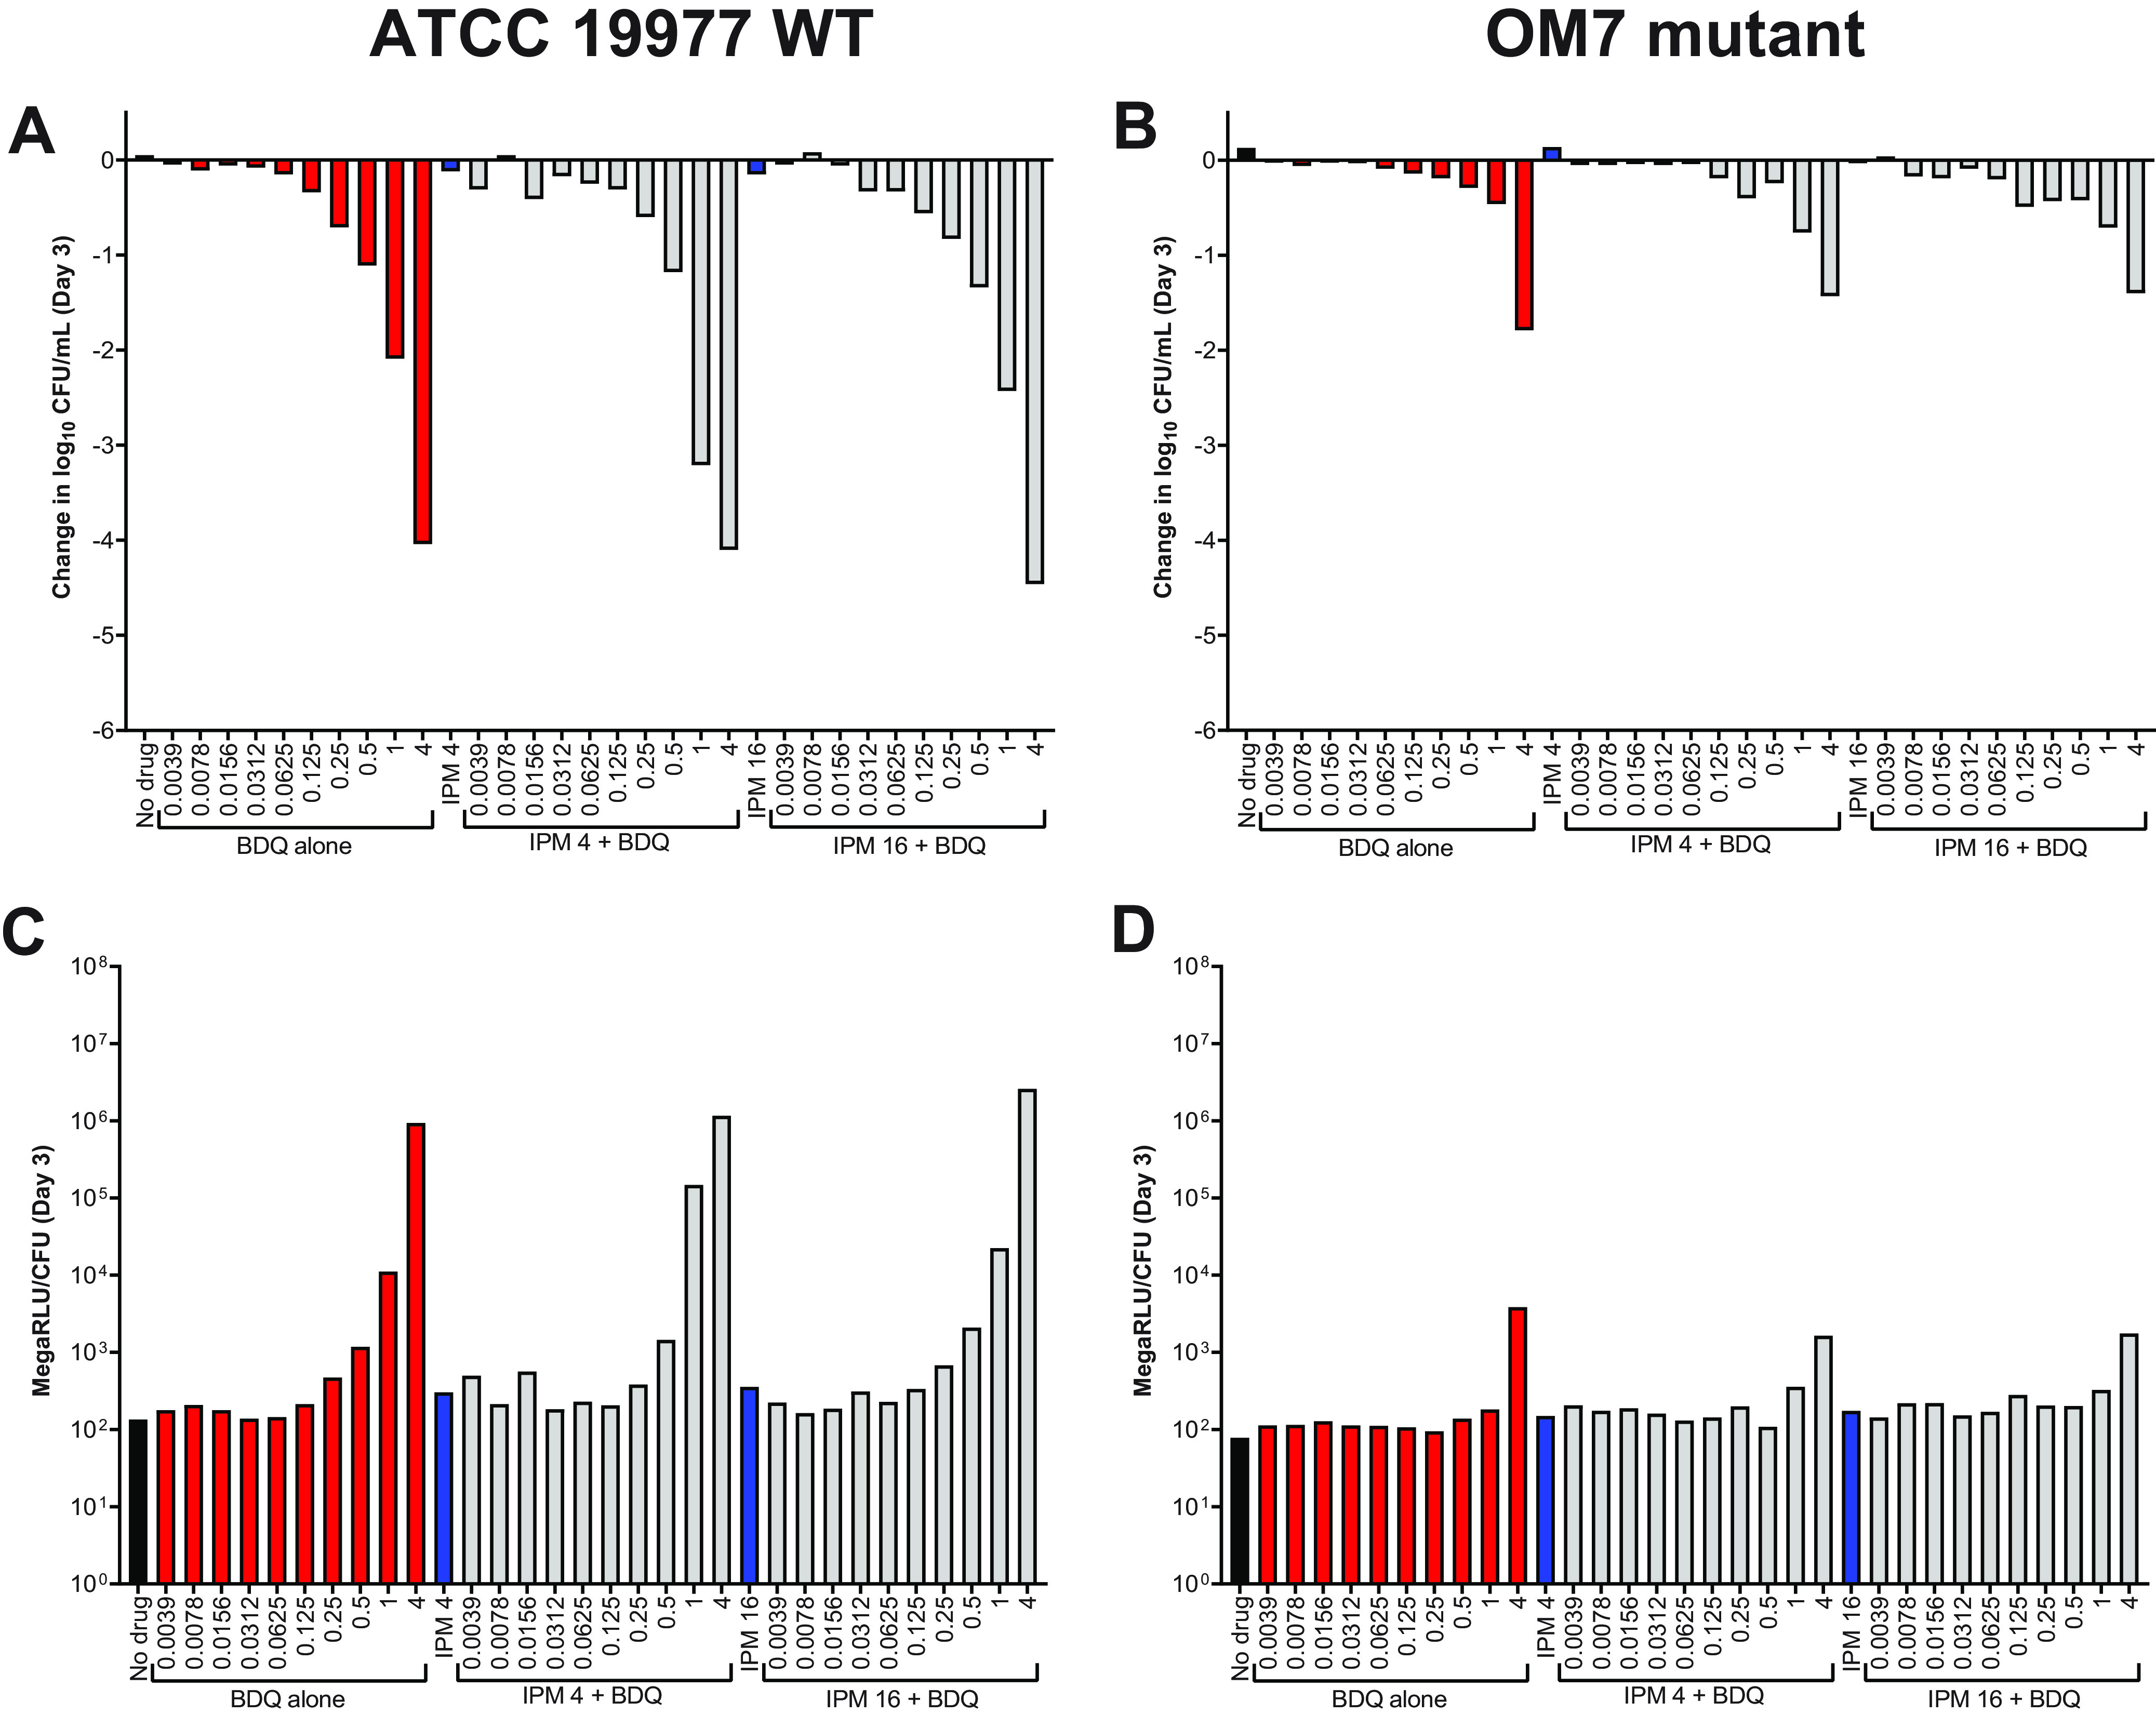
FIG 7.

Activity of bedaquiline (BDQ) and imipenem (IPM) against nutrient-starved M. abscessus ATCC 19977 WT (A) and OM7 mutant (B), with relative bacterial ATP levels (C, D), in PBS without Tween 80. Bacteria were nutrient-starved in PBS for 14 days prior to drug exposure. The changes in log10 CFU/ml after 3 days of drug exposure relative to Day 0 are presented in panels A and B; CFU-adjusted ATP levels, indicated by relative light units (RLU)/CFU from samples after 3 days of drug exposure, are presented in panels C and D. Red bars indicate BDQ-only samples; blue bars represent IPM-only samples; and gray bars indicate IPM + BDQ samples. The number after the IPM abbreviation represents the concentration in μg/ml; for red and gray bars, the BDQ concentration in μg/ml is under each bar. Data after 7 days of drug exposure are presented in Fig. S7. RLU/ml (not adjusted for CFU) for WT and OM7 are presented in Fig. S8 and Fig. S9, respectively. The Day 0 bacterial concentration for panels A and B was 6.25 and 6.29 log10 CFU/ml, respectively. CFU and RLU values are provided in Table S9.
