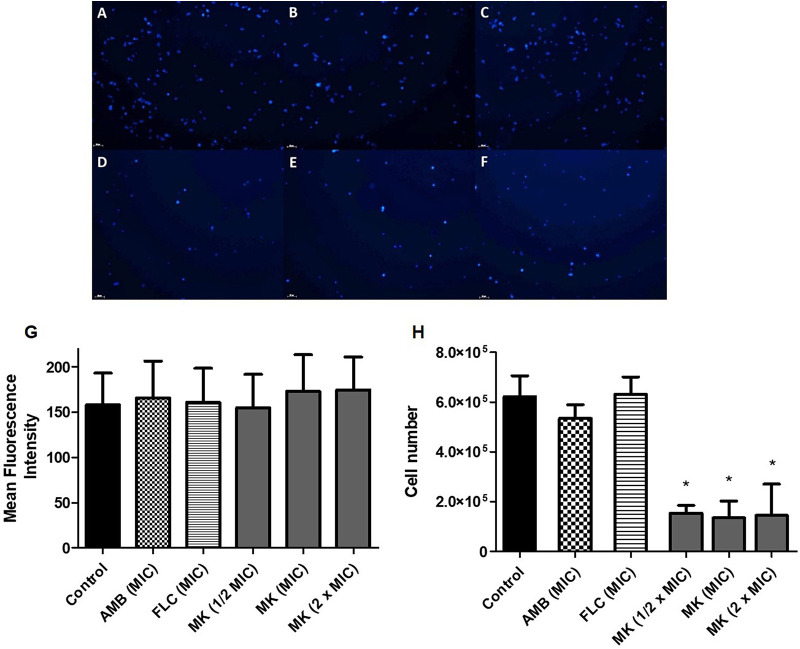
FIG 1.
C. neoformans cells exposed to the peptide for 4 h and marked with calcofluor white. (A) Control; (B) amphotericin B (AMB) at the MIC; (C) fluconazole (FLC) at the MIC; (D to F) peptide MK58911-NH2 (MK) at 1/2× MIC, the MIC, and 2× MIC; (G) average fluorescence intensity per cell; (H) number of cells. Data represent the means (± standard deviations [SD]) from three independent experiments. *, P < 0.05 compared to the control.

