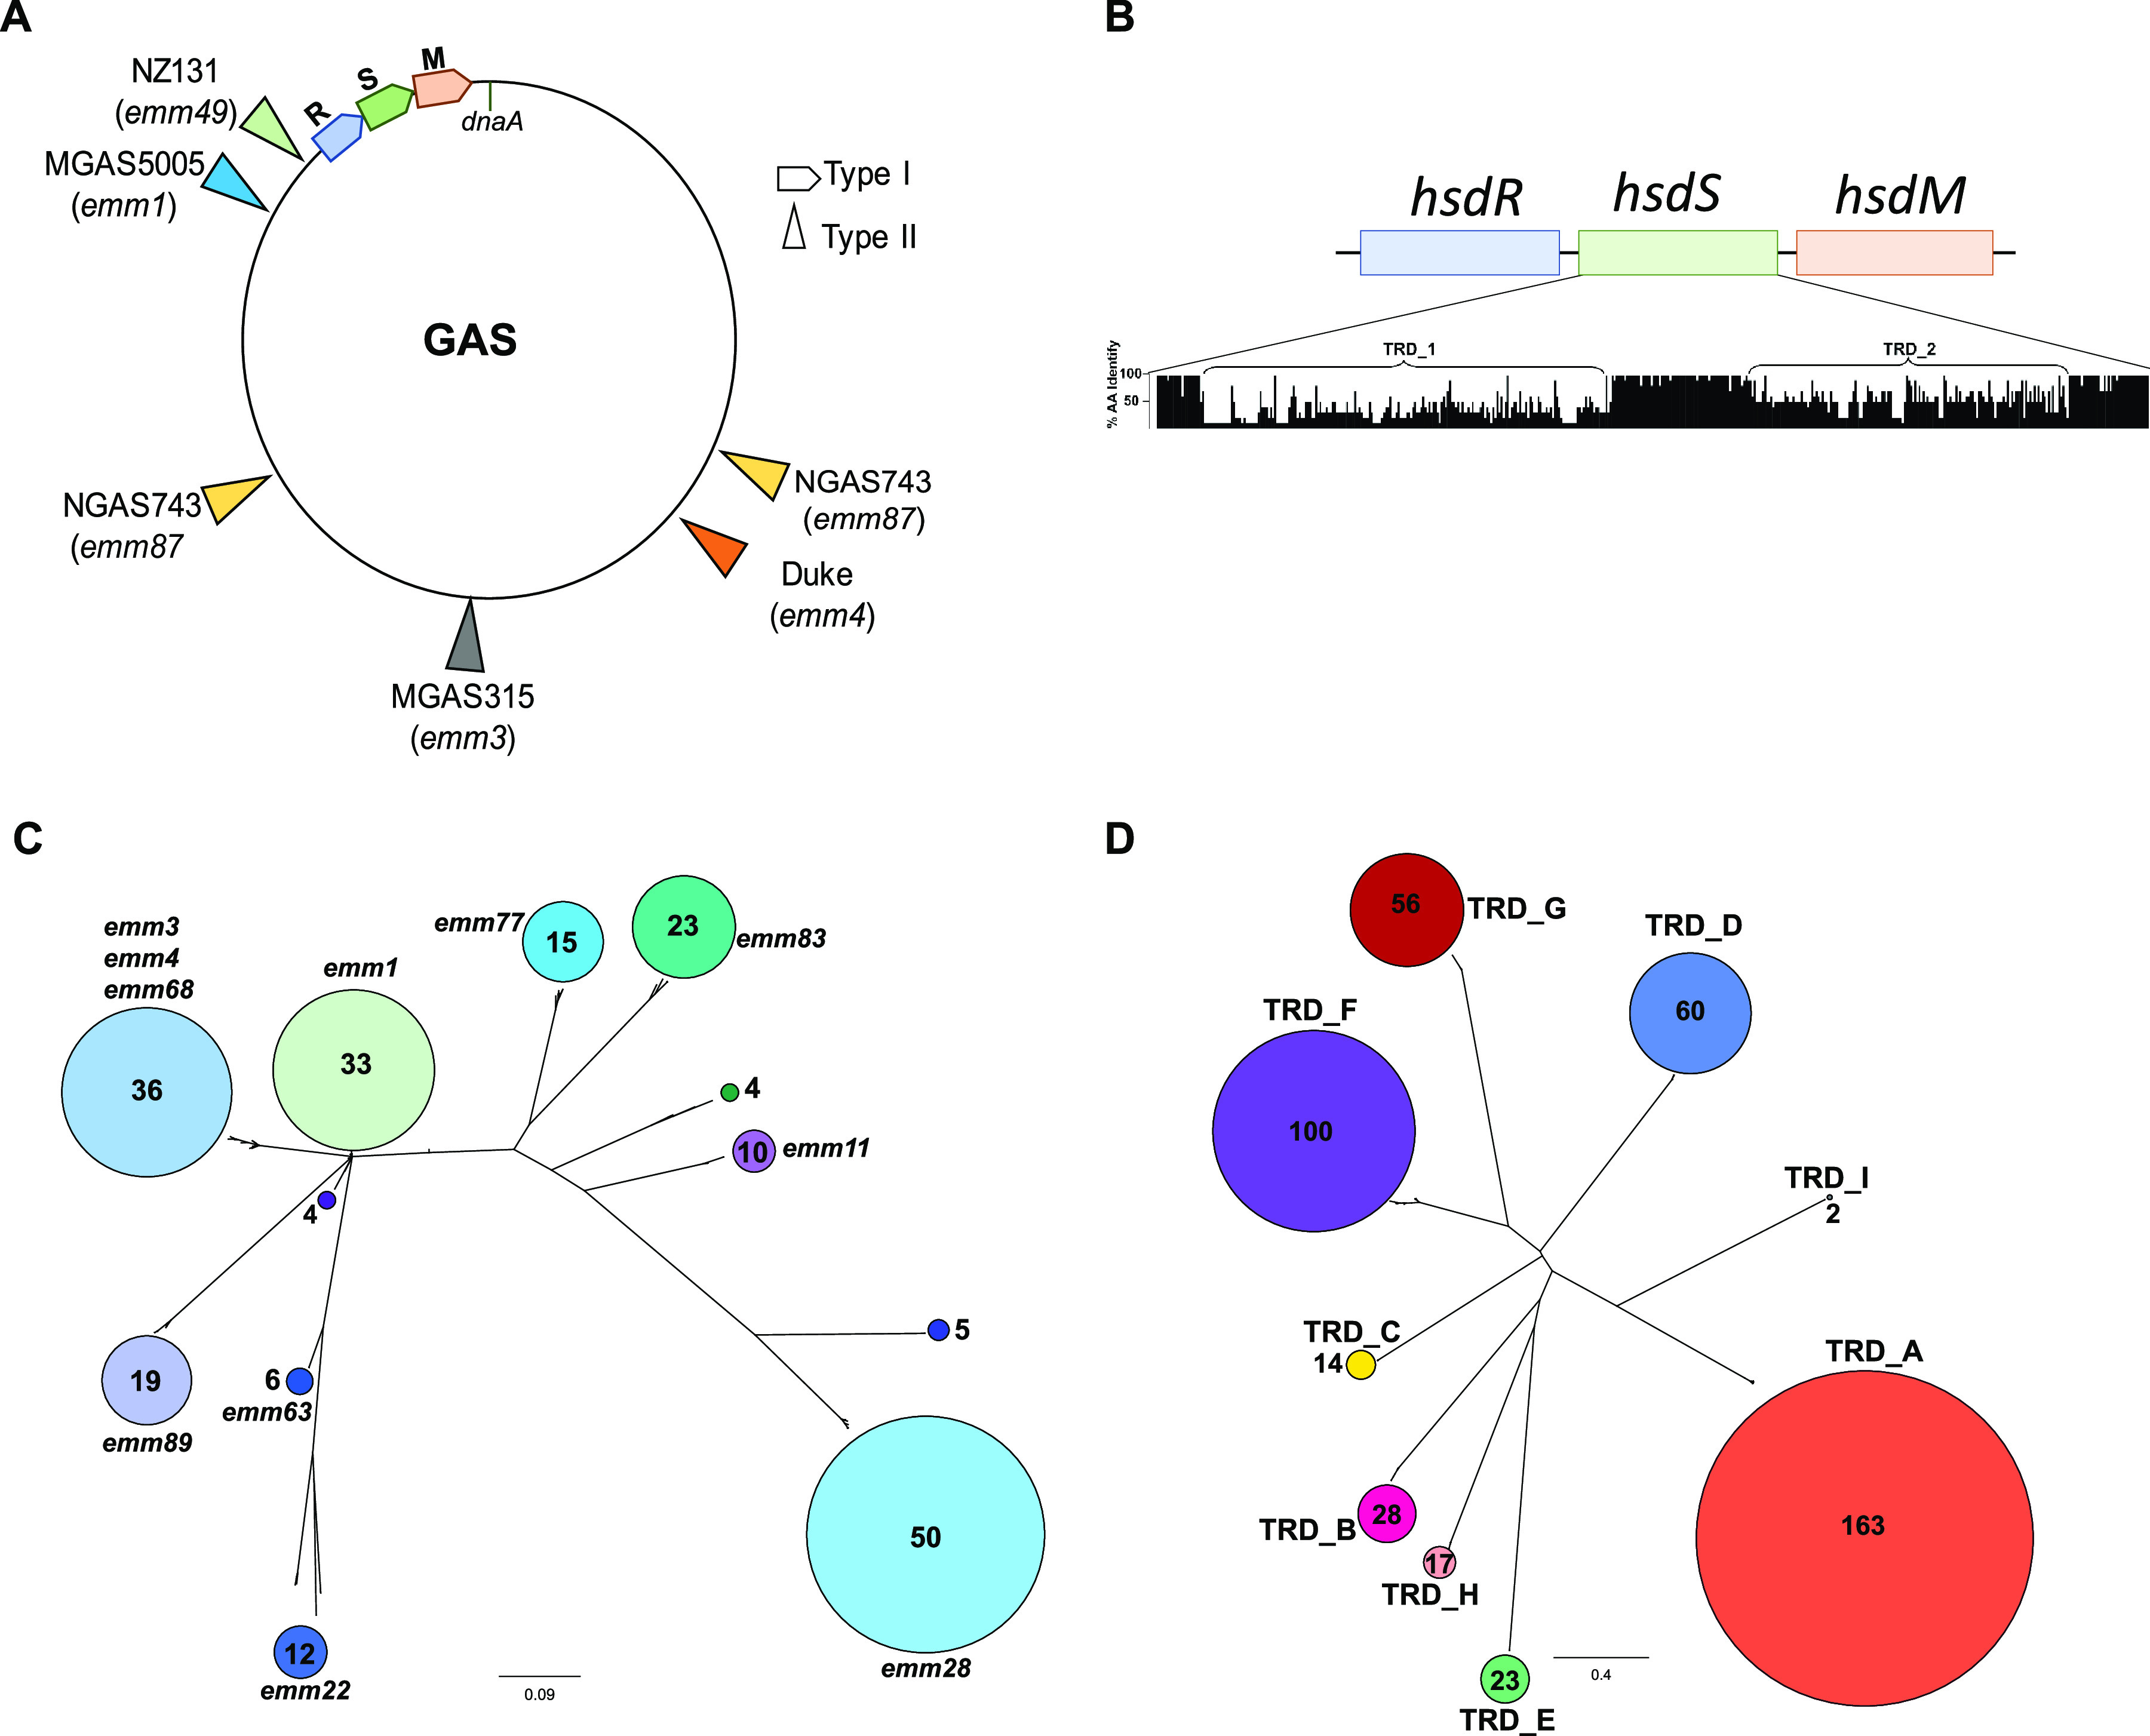
FIG 1.

Overview of GAS type I RM systems. (A) A schematic figure shows the location of the type I RM system on the GAS chromosome. Locations of selected type II RM systems relative to dnaA are also shown, and the respective GAS strain and emm type are indicated in parentheses. (B) Alignment of HsdS sequences from the 10 most common target recognition domain (TRD) patterns identified in our GAS population. The percentage of amino acid identity across each position was calculated using Jalview (72) and is displayed (0 to 100%) on the y axis of the histogram. The x axis indicates amino acid positions. (C and D) Unrooted, neighborhood-joining trees based on (C) full-length HsdS sequences and (D) TRD sequence alignment from the 224 GAS strains in this study. GAS emm types dominating each HsdS cluster are indicated. The number of strains (C) and TRDs (D) in each cluster is indicated within the colored circles and reflected by circle size.
