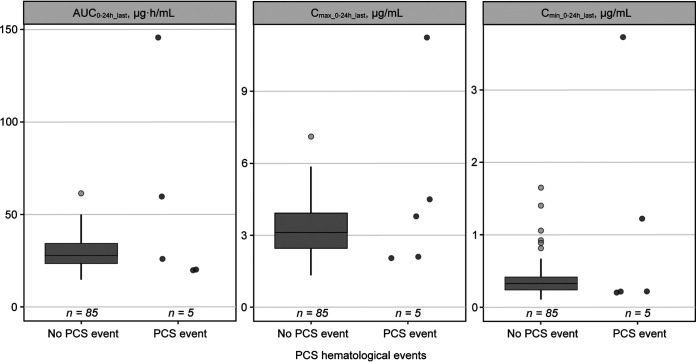
FIG 3.
Distribution of tedizolid exposure in adolescents with versus without PCS abnormal hematology values in the phase 3 PN012 trial in adolescents.a,b. AUC0–24h_last, area under the concentration–time curve from 0 to 24 hours on the last dosing day; Cmax 0–24h_last, maximum concentration of drug in plasma from 0 to 24 hours on the last dosing day; Cmin 0–24h_last, minimum concentration of drug in plasma from 0 to 24 hours on the last dosing day; PCS, potentially clinically significant. aThe participant with Cmax of >9 μg/ml had only one pharmacokinetic data point available to estimate tedizolid exposure. One participant had missing values and could not be evaluated. bThe participant with the highest predicted AUC0–24h_last had very high tedizolid plasma concentrations that were mostly excluded as outliers. The AUC0–24h_last for this participant was predicted based on a single concentration measurement after outlier exclusions and should therefore be interpreted with caution.

