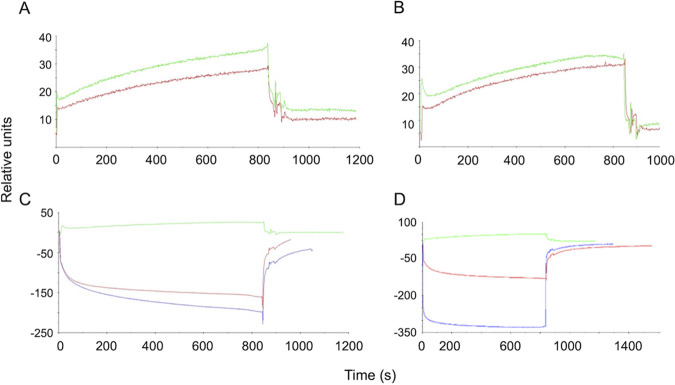
FIG 2.
SPR sonogram representative of the interaction of the chitooligomer MAbs with chitotriose. The ligands tested were the MAbs DD11 (A) and CC5 (B). (C and D) Negative controls for MAbs DD11 and CC5, respectively. The surfaces of the flow cells were activated and the ligands immobilized at 100 μg/ml in 10 mM sodium acetate, pH 5.0. In panels A and B, red and green lines correspond to the interaction of the MAbs with of 0.06 nM and 0.1 nM chitotriose, respectively. In panels C and D, the green lines represent chitotriose (0.06 nM), while red and blue lines represent BSA and glycine, respectively, at the same concentration. The analyte injection corresponds to time zero. The rise of the curves represents analyte-substrate binding. Approximately 800 s after injection, disassociation starts, resulting in the abrupt drop of the curves. Response units were generated by the equipment's software.

