Figure 4.

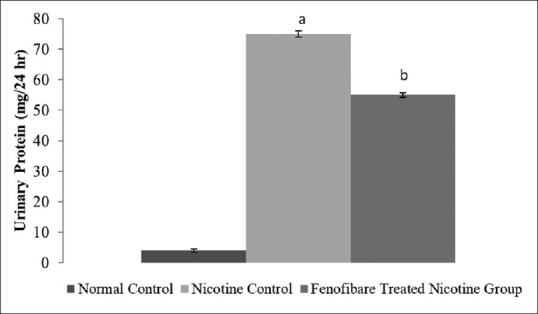
Effect of fenofibrate on urinary Protein. All values are represented as mean ± S.D. a = p < 0.05 vs Normal Control; b = p < 0.05 vs Nicotine Control

Effect of fenofibrate on urinary Protein. All values are represented as mean ± S.D. a = p < 0.05 vs Normal Control; b = p < 0.05 vs Nicotine Control