FIGURE 2.
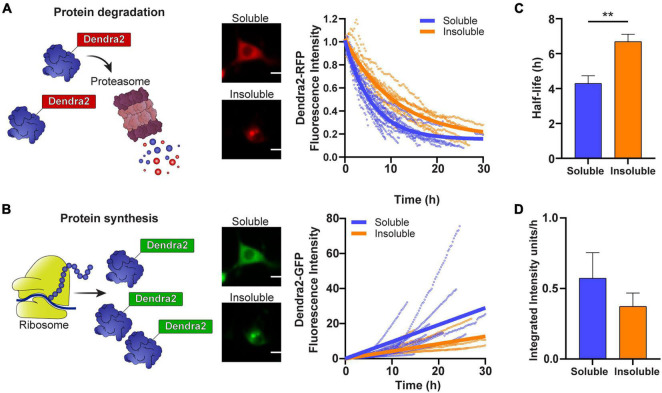
The degradation and synthesis of SOD1 are slowed in cells containing insoluble aggregates. (A) The degradation of SOD1-Dendra2-RFP signal and (B) synthesis of SOD1-Dendra2-GFP signal was tracked in NSC-34 cells expressing soluble or insoluble SOD1A4V over 30 h. Data shown are representative of non-linear and linear regression curves (solid lines) and individual cell traces (n = 18 soluble SOD1A4V, n = 12 insoluble SOD1A4V) from one replicate. (C) The half-life and (D) synthesis rate of SOD1 were determined from the Dendra2 signal in NSC-34 cells expressing soluble and insoluble SOD1A4V-Dendra2. Data represent mean ± SEM (n = 4 replicates, 59 single cell measurements, taken from data set in Figure 1). Statistical significance between groups was determined with an unpaired Student’s t-test (**p < 0.01). Scale bars: 10 μm.

