An official website of the United States government
Here's how you know
Official websites use .gov
A
.gov website belongs to an official
government organization in the United States.
Secure .gov websites use HTTPS
A lock (
) or https:// means you've safely
connected to the .gov website. Share sensitive
information only on official, secure websites.
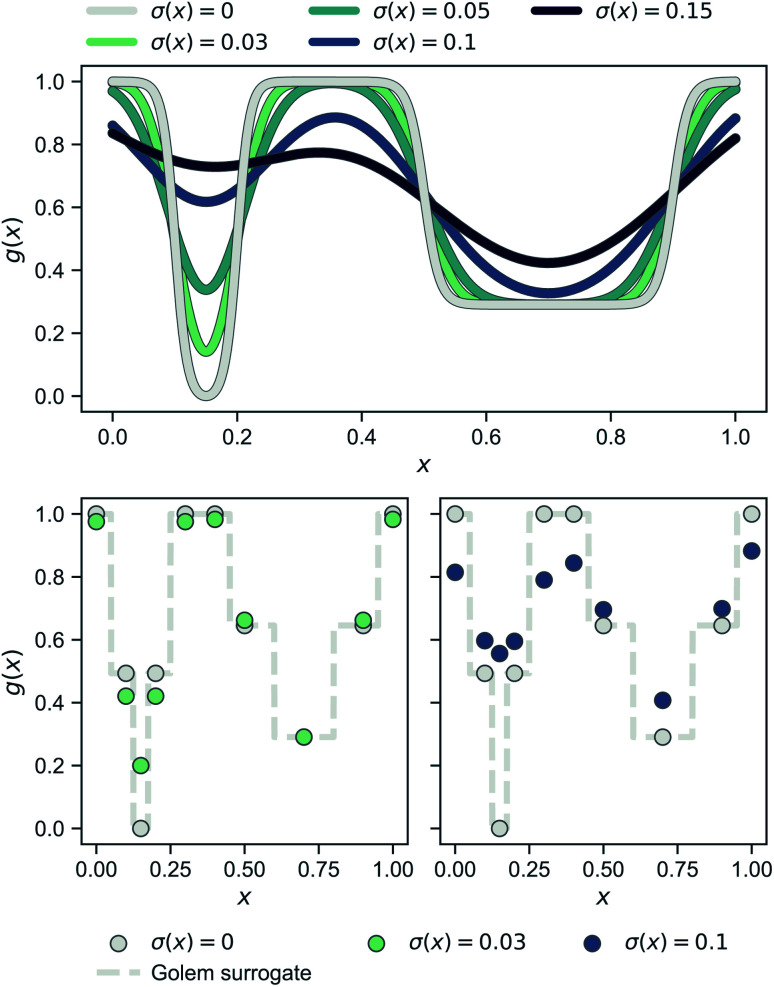
 changes as the standard deviation of normally-distributed input noise p(x̃) is increased. Note that the curve for σ(x) = 0 corresponds to the original objective function. The panels at the bottom show the robust merits of a finite set of samples as estimated by Golem from the objective function values.