. 2021 Oct 12;12(44):14792–14807. doi: 10.1039/d1sc01545a

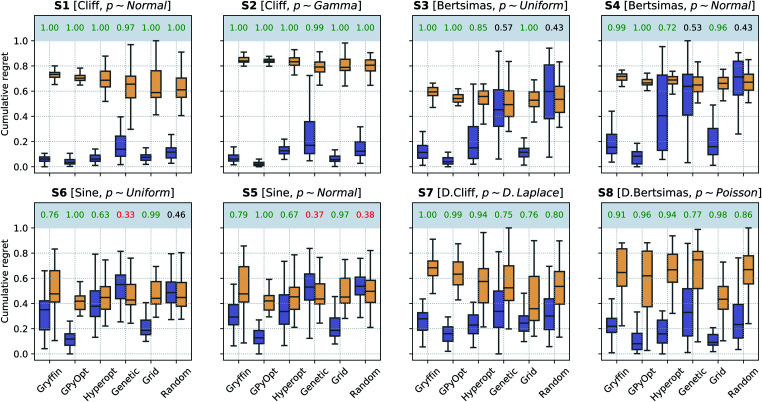
Fig. 4. Robust optimization performance of multiple algorithms, with and without Golem, in benchmarks where queries were noiseless. Box plots show the distributions of cumulative regrets obtained across 50 optimization repeats with and without Golem, in purple and yellow, respectively. The boxes show the first, second, and third quartiles of the data, with whiskers extending up to 1.5 times the interquartile range. At the top of each plot, we report the probability that the use of Golem improved upon the performance of each algorithm. Probabilities are in green if the performance with Golem was significantly better (considering a 0.05 significance level) than without, and in red if it was significantly worse, as computed by bootstrap.

Fig. 4