. 2021 Oct 12;12(44):14792–14807. doi: 10.1039/d1sc01545a

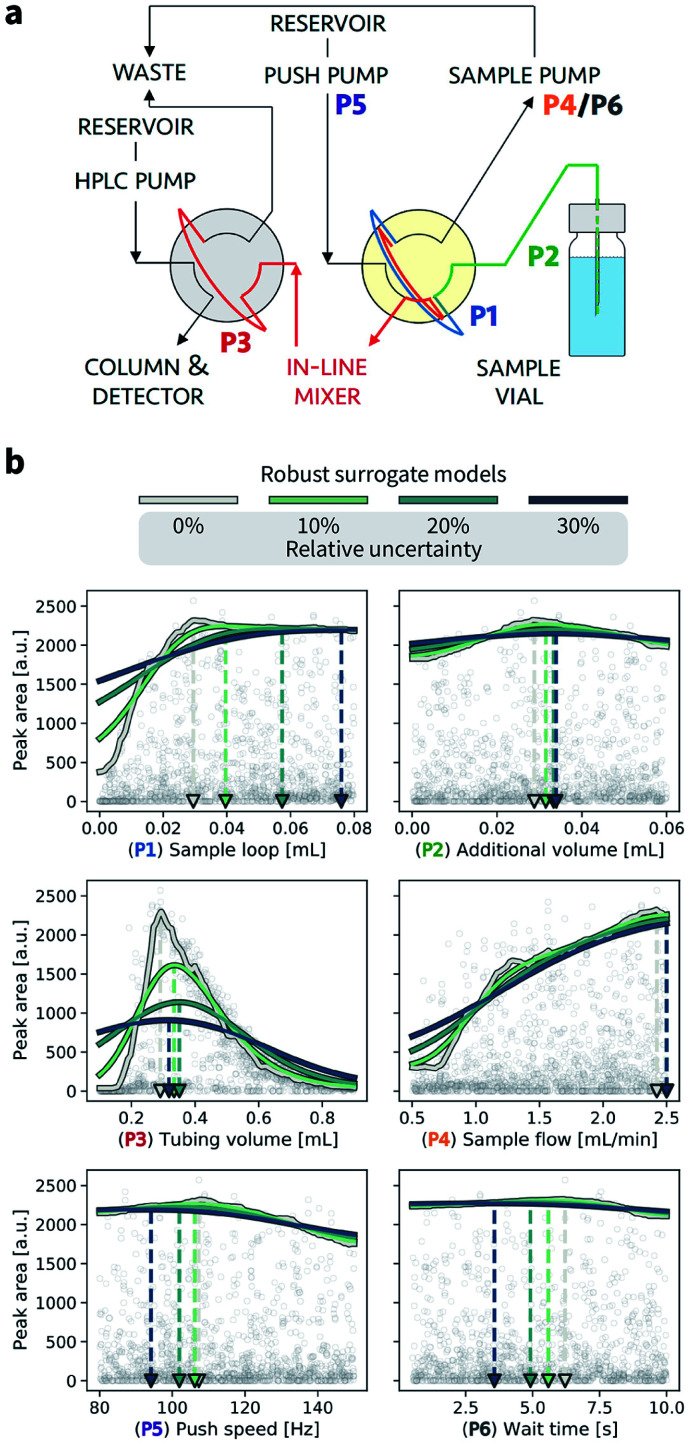
Fig. 7. Analysis of the robustness of an HPLC calibration protocol. (a) Flow path for the HPLC sampling sequence performed by a robotic platform. The six parameters (P1–P6) are color coded. The yellow shade highlights the arm valve, and the gray shade the HPLC valve. (b) Golem analysis of the effect of input noise on expected protocol performance. A surrogate model of the response surface is shown in gray. Uncertainties were modeled with truncated normal distributions with standard deviations of 10%, 20%, 30% of each parameter's range. The corresponding robust surrogate models are shown in light green, dark green, and blue. Triangular markers and dashed lines indicate the location of the optima for each parameter under different levels of noise.

Fig. 7