Figure 5.
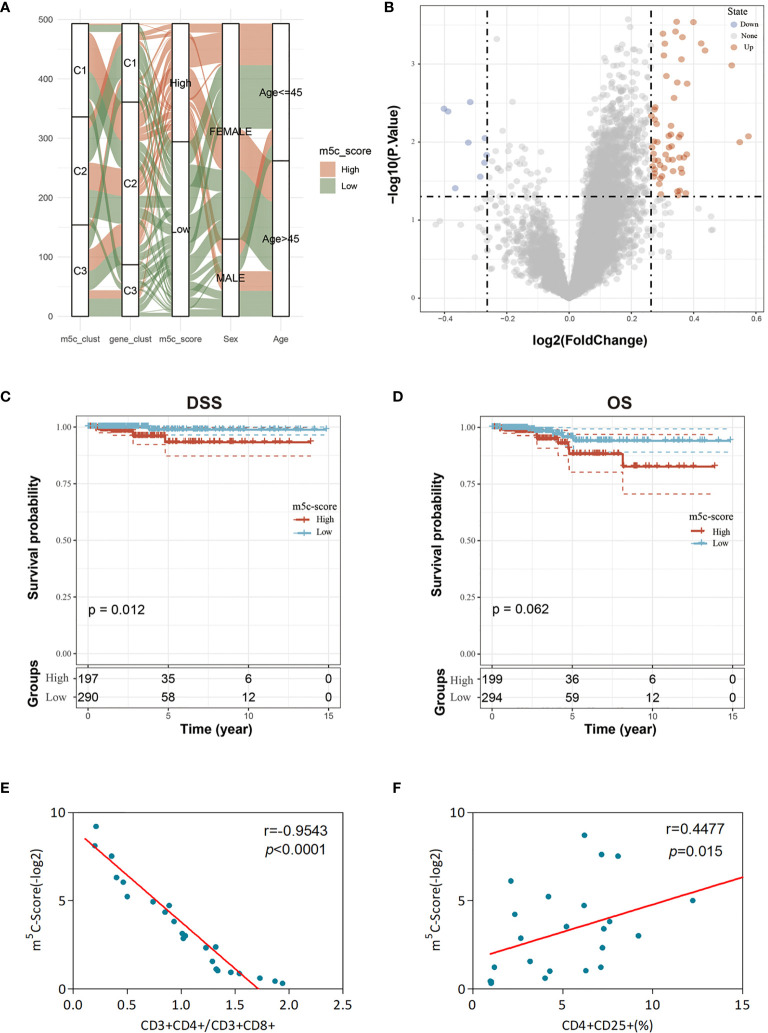
Clinical features and transcriptome traits of the m5C-associated phenotypes. (A) Alluvial diagram showing the changes of m5C modification patterns, gender, age, gene cluster, and the m5C-score. (B) DEGs between high and low m5C-score samples. (C, D) Differences in DFS (C) and OS (D) between high and low m5C-score samples. (E) Relationship between the m5C-score value and the score of CD3+CD4+/CD3+CD8+ cells of the peripheral blood samples of 24 GBM patients. The m5C-Score value was negatively associated with the ratio of CD3+CD4+/CD3+CD8+ cells. (F) Relationship between the m5C-score value and the percentage of CD4+CD25+ Tregs in peripheral blood samples of the 24 GBM patients. The m5C-score value was positively related with the percentage of CD4+CD25+ Tregs.

