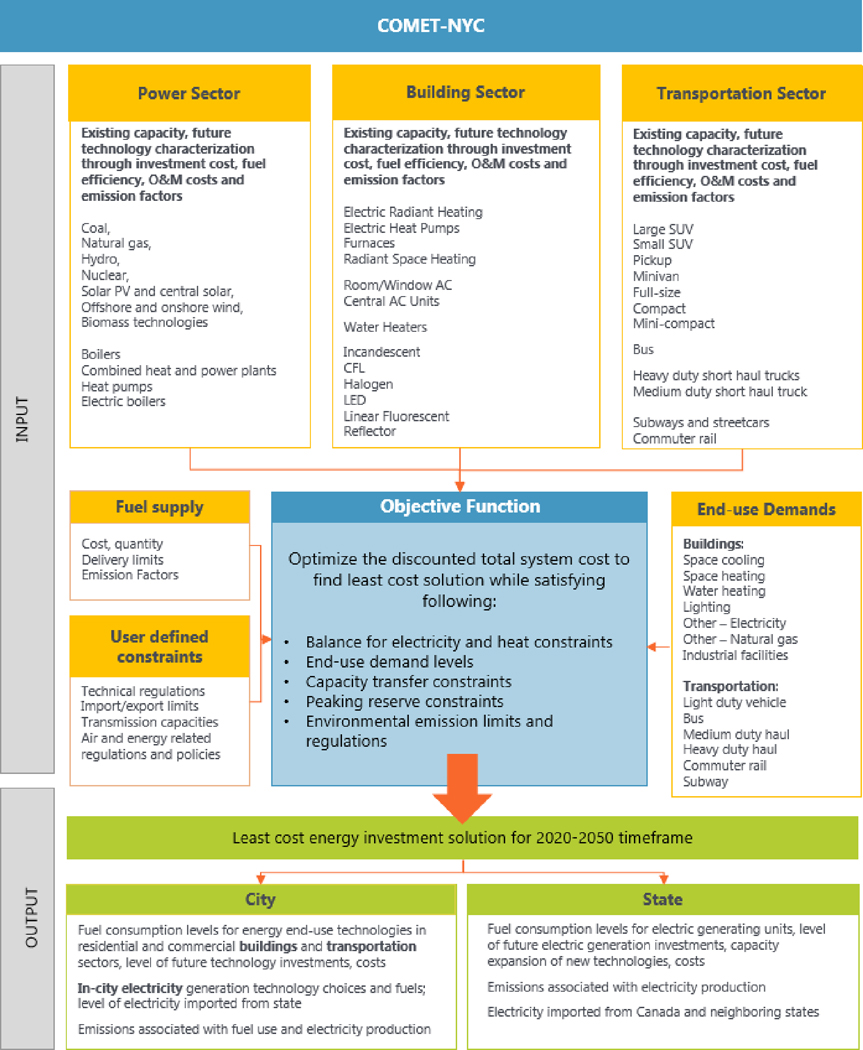
Figure 1. Figure 1 City-based Optimization Model for Energy Technologies: COMET-NYC structure.
This figure provides basic structural information about COMET-NYC. The objective function parameters are depicted in blue. Groups of constraints, model data requirements for each sector in the energy system and variables are presented in orange boxes where these parameters are the main inputs to the model. The outputs are listed in green boxes. The arrows show the information flow within the model.

