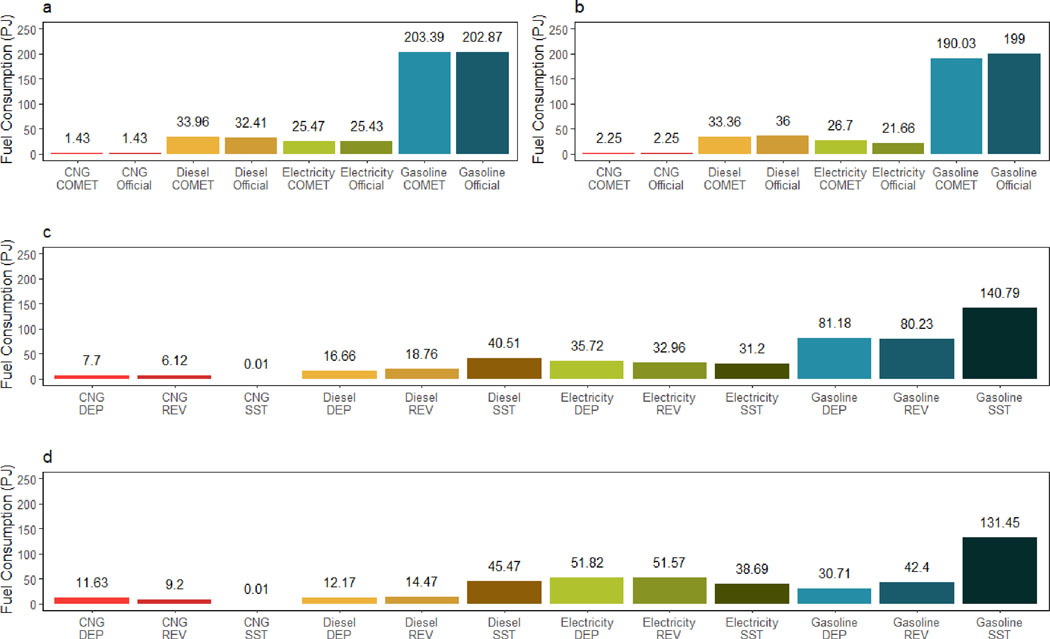
Fig. 2: Fuel consumption in PJ in transportation sector for STEADY-STATE (SST), DEPENDENCE (DEP) and REVOLUTON (REV).
Each chart represents a specific time in the modelling horizon: Panel (a) presents 2010, panel (b) represents 2015 modeling horizon. The vertical bar graph compares the fuel consumption reported by the city and model results that belong to transportation sector for the calibration years 2010 and 2015. (c) and (d) show the resultant transportation sector fuel consumption for STEADY-STATE, DEPENDENCE and REVOLUTION scenarios for 2030 and 2050. The color group represents the fuel type and each shade of the bar denotes the scenario type. See Supplementary Fig. 7 for city-wide electricity consumption, and transportation sector electricity consumption for all scenarios.

