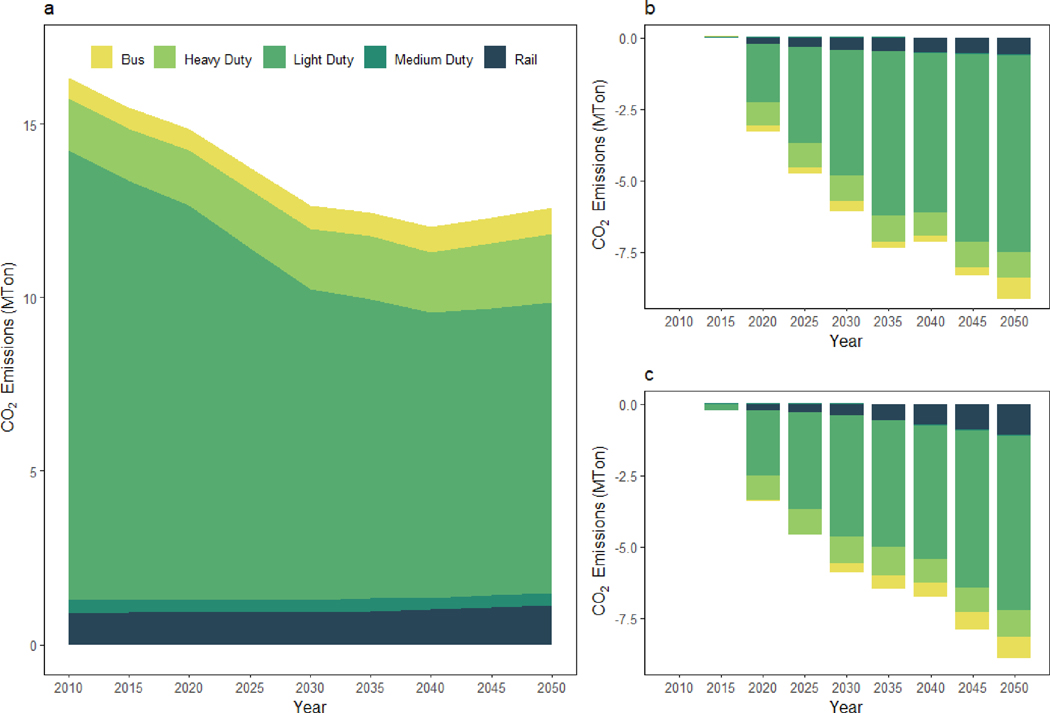
Fig. 4: Figure 4 Transportation CO2 emissions in MTon in STEADY-STATE (SST), and emissions changes in DEPENDENCE (DEP) and REVOLUTON (REV) relative to STEADY-STATE.
The stacked area chart that belong to STEADY-STATE scenario shows the CO2 emissions with respect to the mode of transportation. The downward growing stacked bar charts represent the emission reduction projections with respect to the STEADY-STATE scenario. For instance, DEP-SST is the difference between CO2 emissions in DEPENDENCE and STEADY-STATE for each modeling year. See Supplementary Fig. 9 for results for sensitivity runs, i.e. BATTERY, TNC and MODESWITCH.

