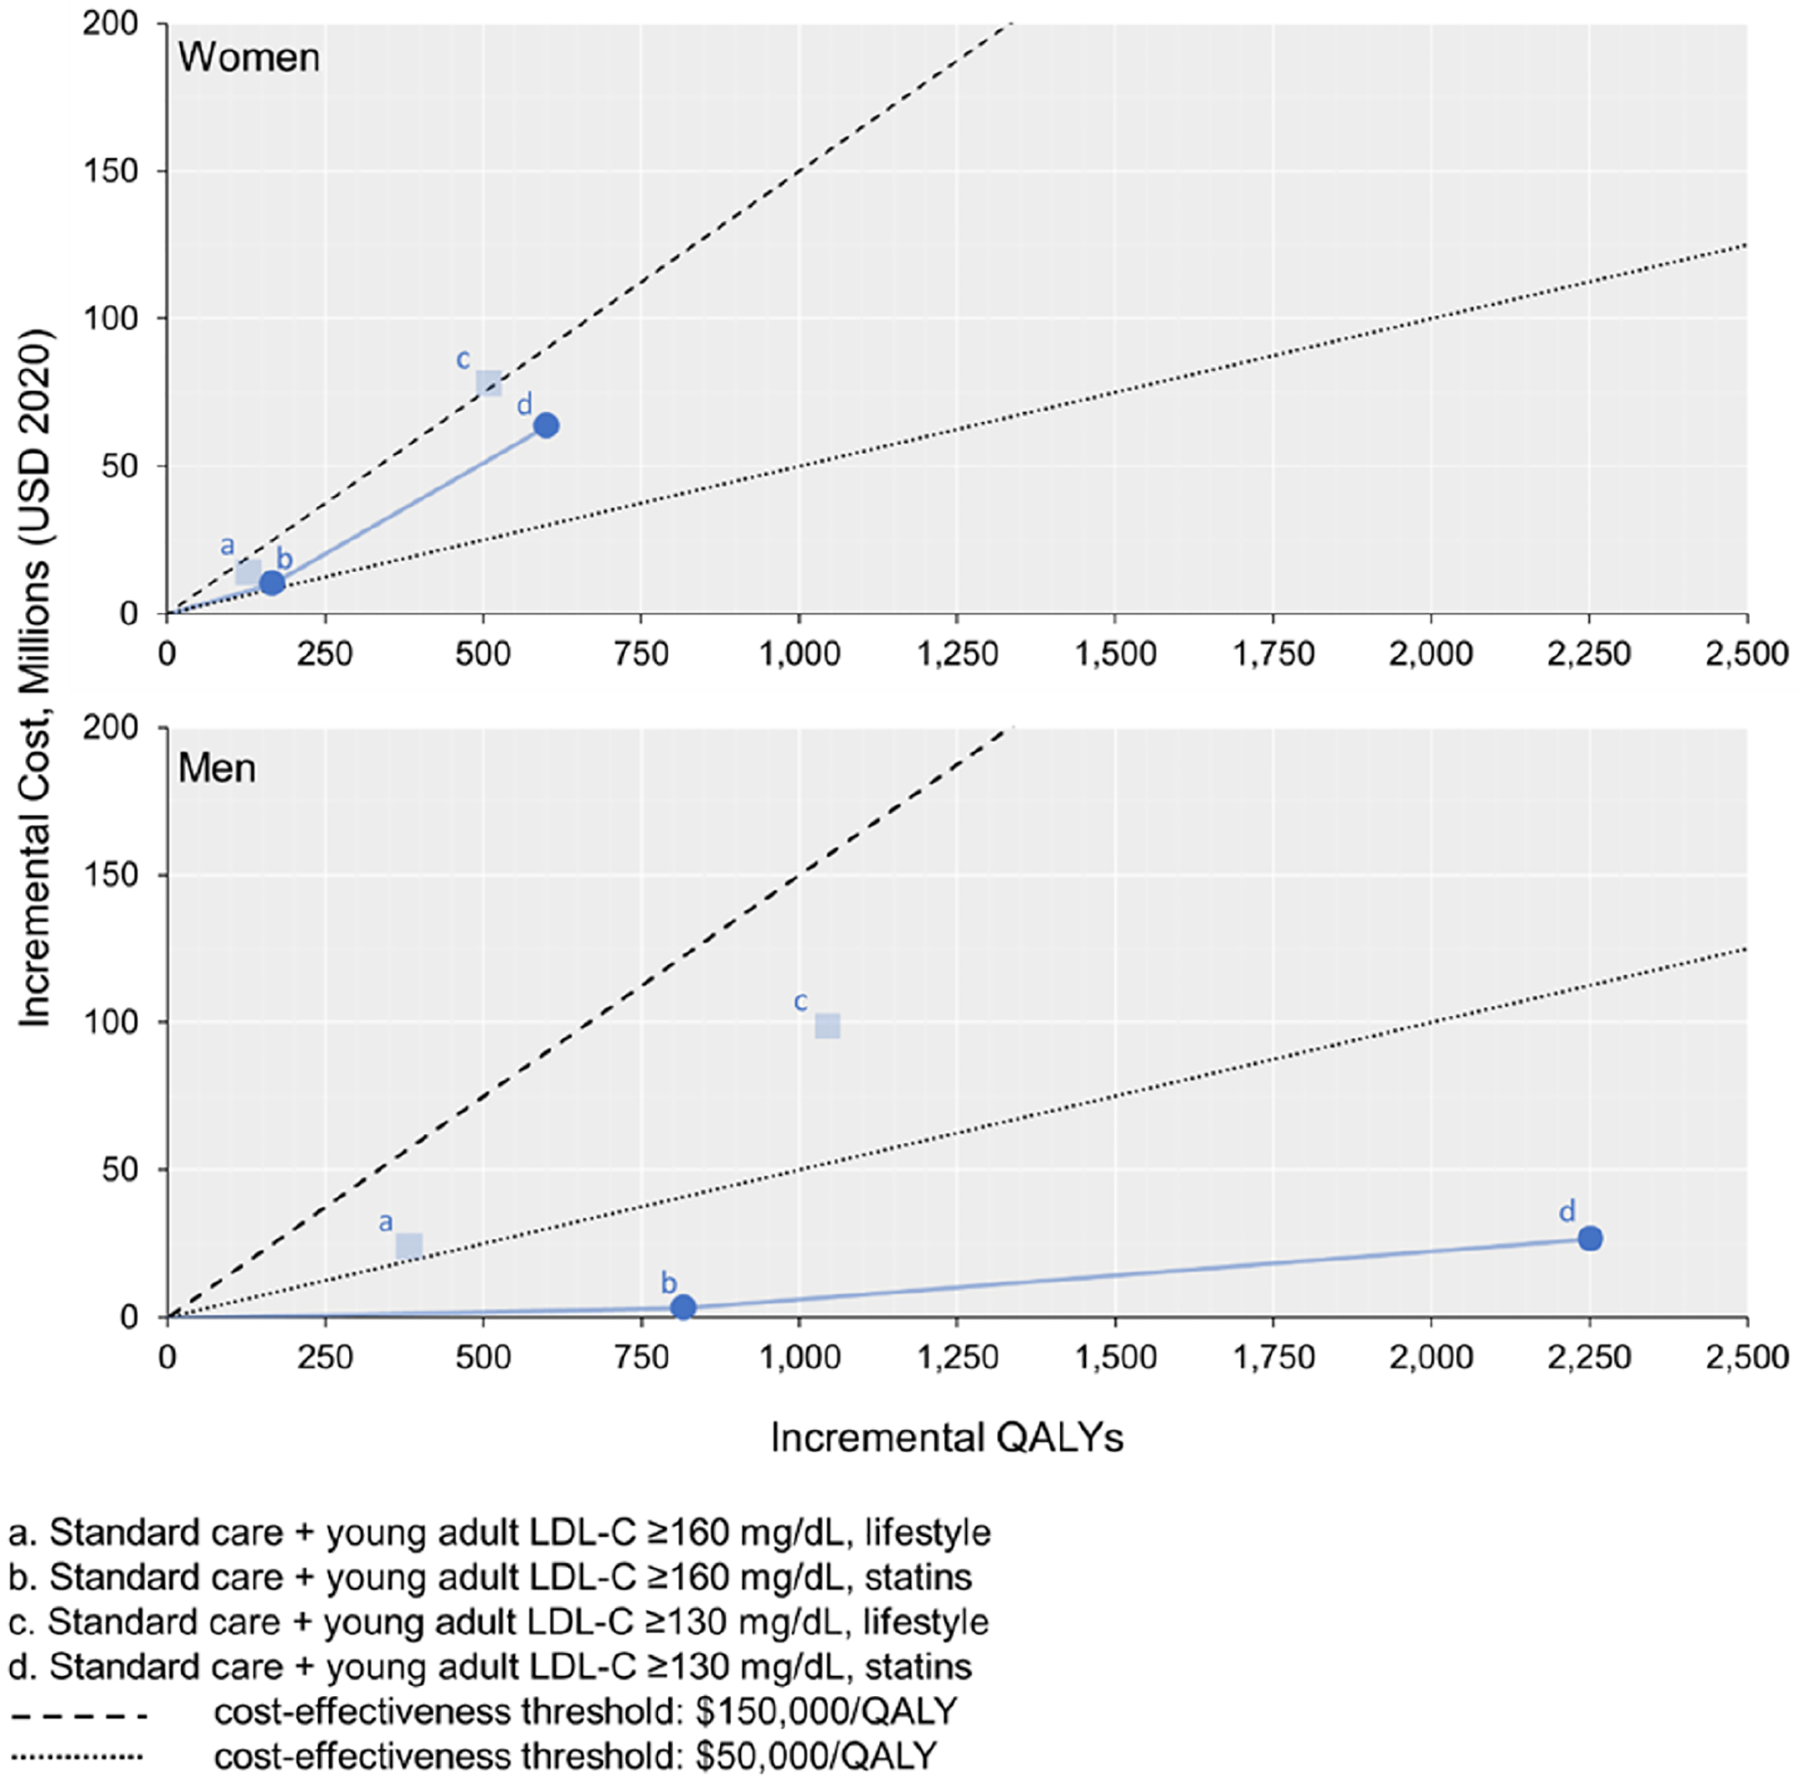
Figure 2. Cost-effectiveness plane for lipid-lowering strategies in U.S. young adults.

The transparent points illustrated indicate that the strategy costs more and is less effective than another strategy (i.e., strictly dominated). The solid blue lines represent strategies that are eligible to be considered the preferred treatment (i.e., the cost-effectiveness frontier, which comprises the non-dominated strategies ranked by increasing effectiveness). A strategy is considered cost-effective if the slope of the blue line connecting it to the next least effective strategy (i.e., the incremental cost-effectiveness ratio) is lower than the slope of the cost-effectiveness threshold line. The preferred strategy is defined as the treatment that results in the greatest QALY gains and is cost-effective. LDL-C - low-density lipoprotein cholesterol; QALYs – quality-adjusted life years. To convert LDL-C from mg/dL to mmol/L, divide by 38.67.
