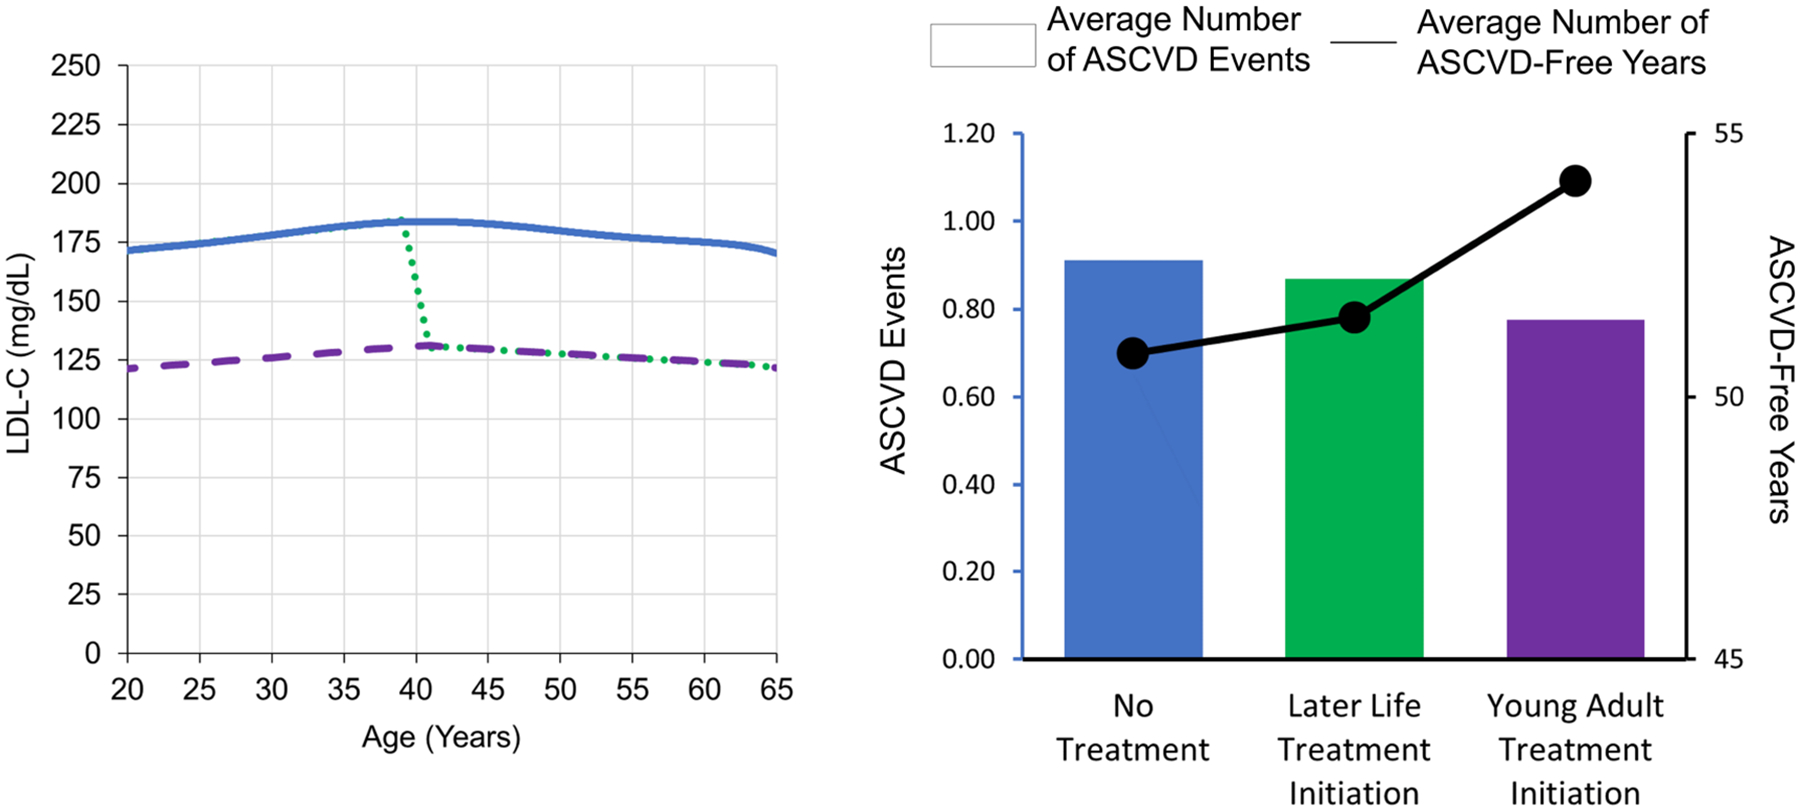
Central Illustration. Conceptual diagram, CVD Policy Model and time-weighted average risk factors.

Panel A (left): Potential LDL-C trajectories for a 20-year-old young adult with raised LDL-C (172 mg/dL) are shown: no treatment (blue), later life statin treatment (green), and lifetime statin treatment (purple). Panel B (right): Results are shown for 100,000 simulations of the three LDL-C trajectories in Panel A while holding other risk factors constant. Mean number of ASCVD events (left axis) was lower and mean ASCVD-free years (right axis) was greater with treatment initiation in young adulthood.
