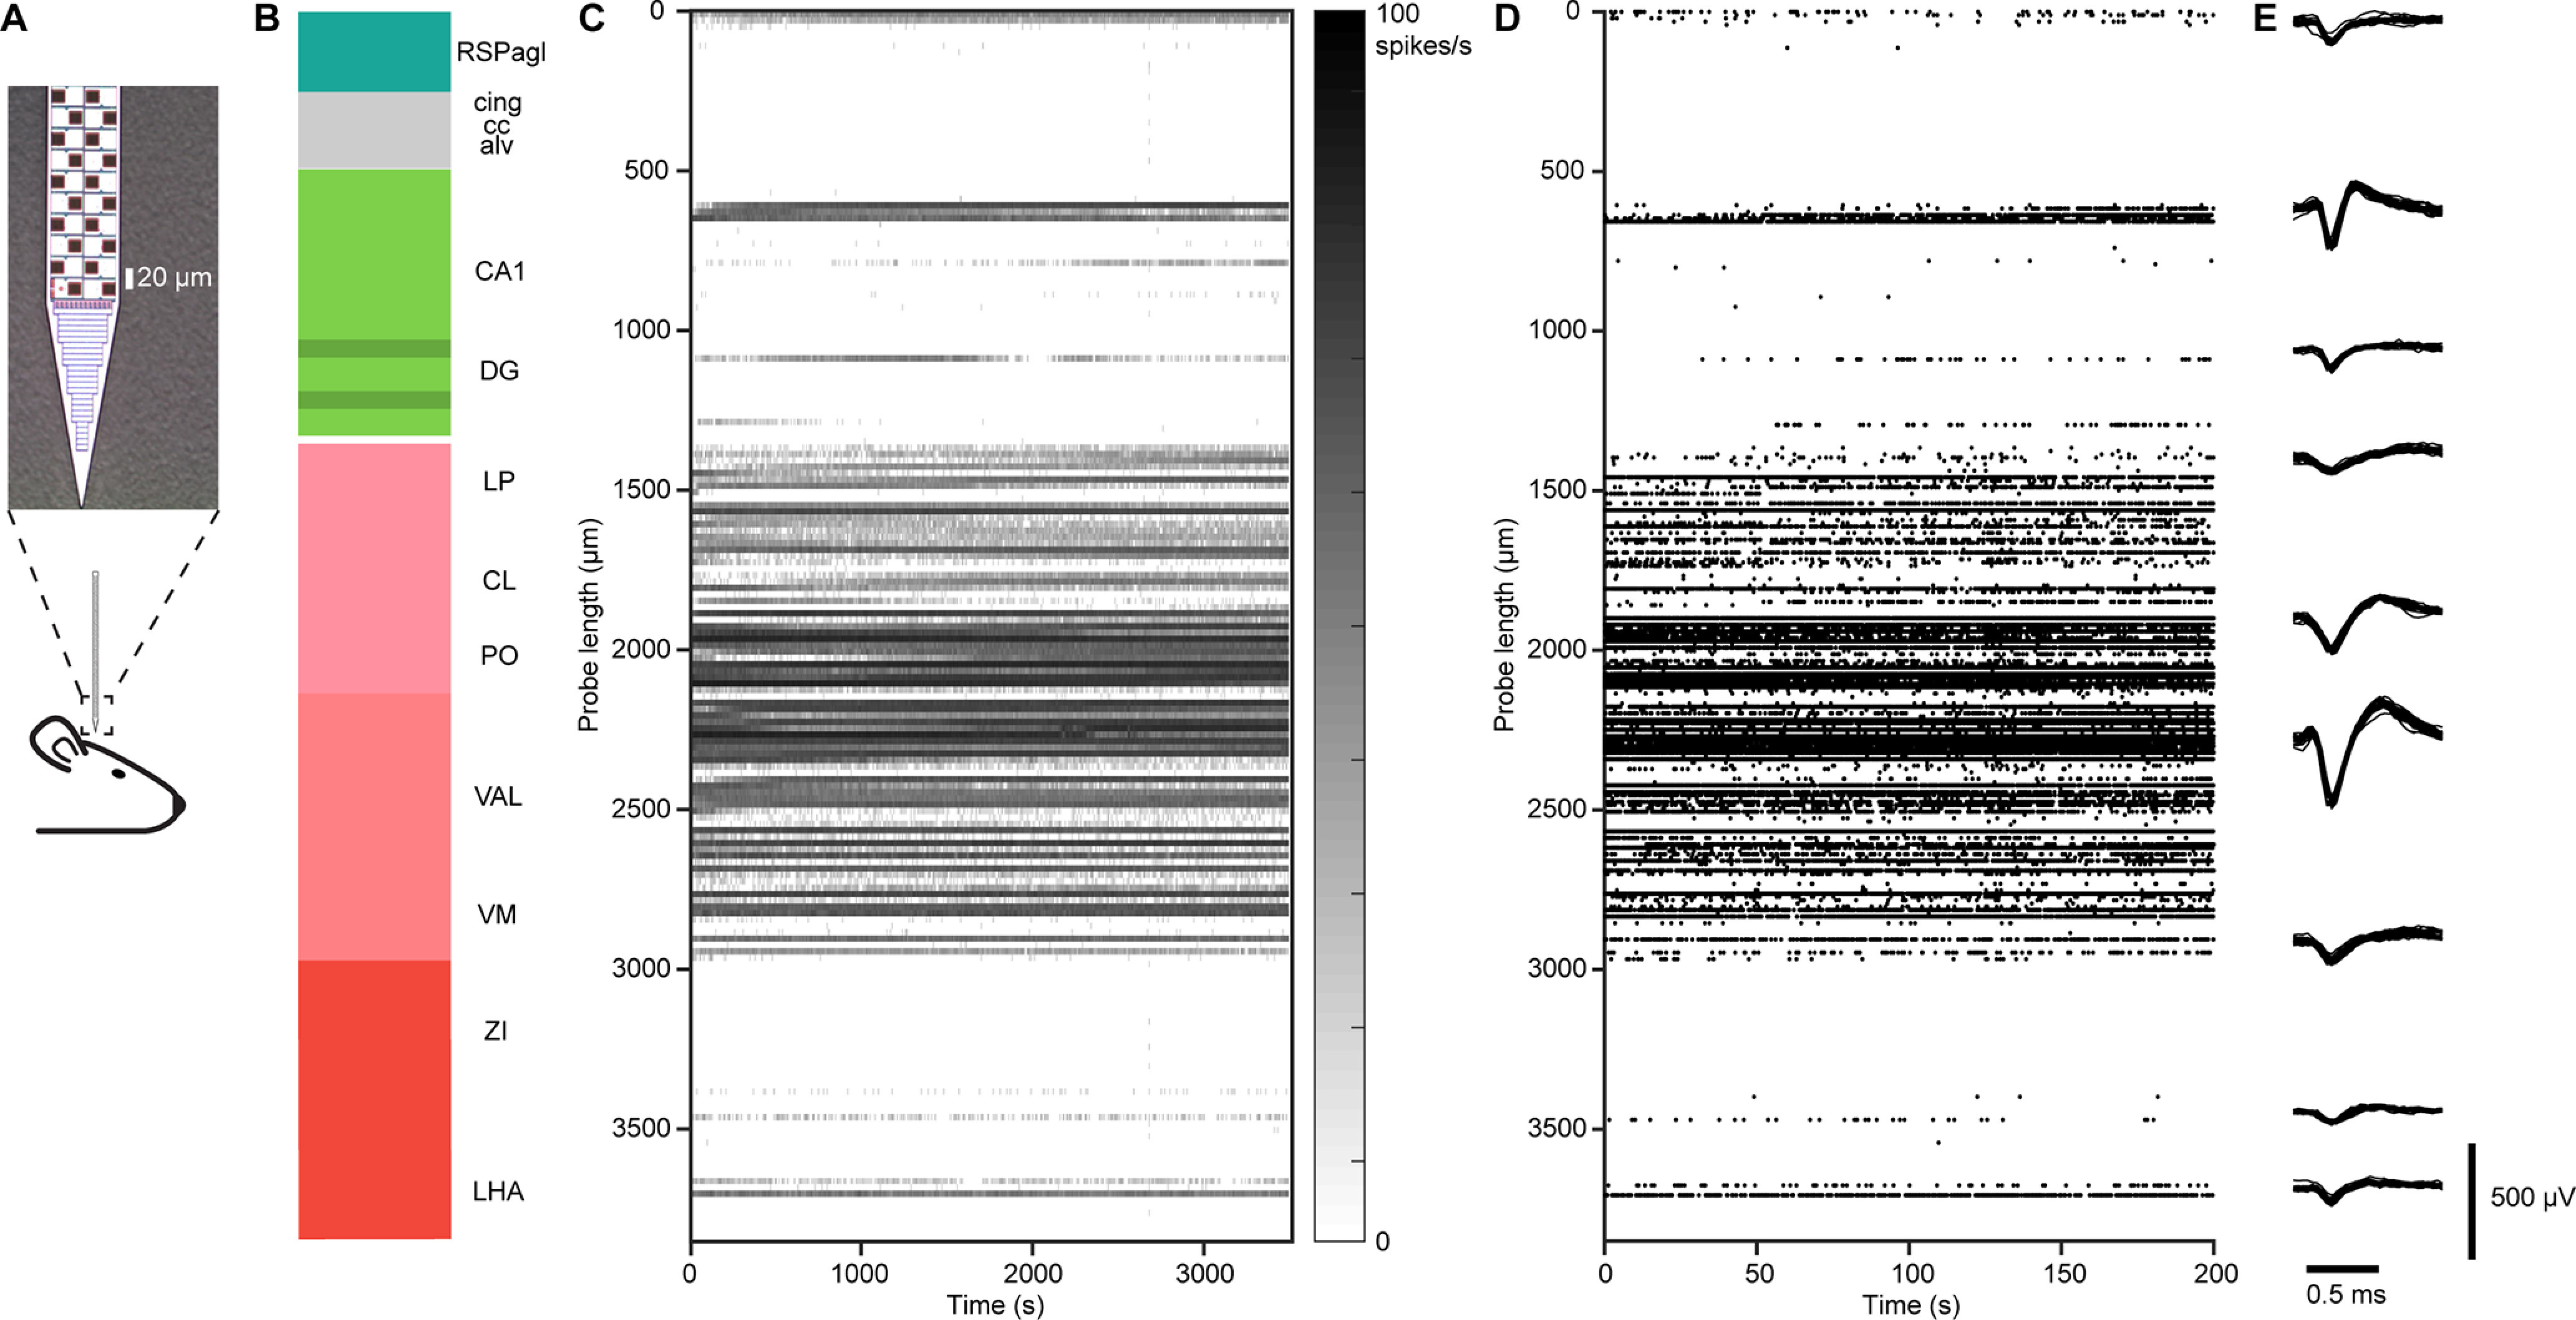
Figure 2.

Neuropixels probe recording. A, Schematic of the recording. Top, Image of the Neuropixels probe tip showing layout of electrodes. B, An example penetration. The color along the probe track shows ARA compartments. C, Spike rate showing multiunit activity (threshold −70 μV) across electrodes along the probe in B, where 0 is the position of the most superficial electrode. The spike rate is binned at 10 s and 20 μm. The y-axis indicates the position of the spikes on the probe. Data from 3500 s of continuous recording. D, First 200 s of spike rasters showing multiunit activity across electrodes along the probe in C. Each event corresponds to a dot on the raster plot. Waveforms from nine example single units. A total of 25 overlaid waveforms each. The vertical position indicates an approximate position along the probe.
