
Figure 2.
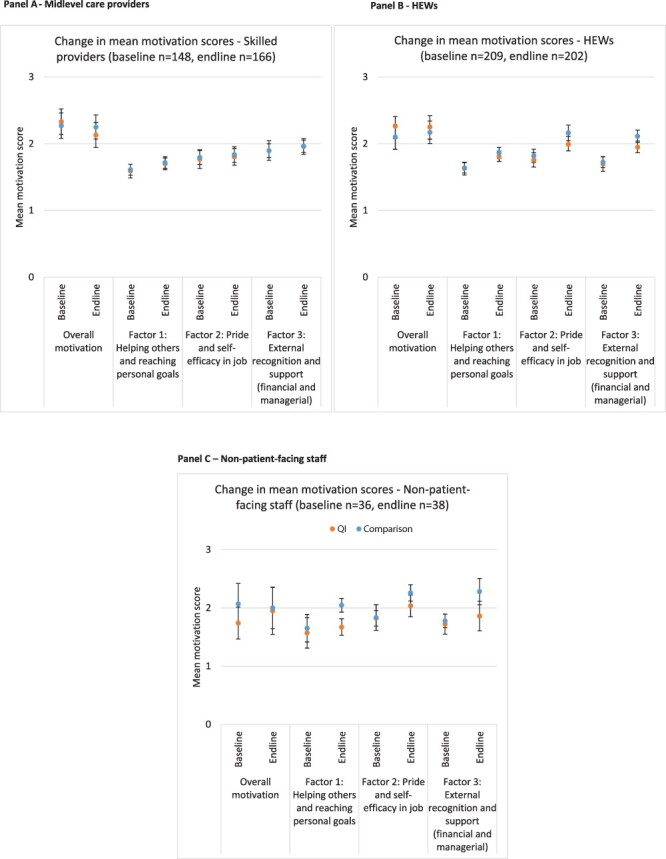
Change in mean factor scores at baseline and endline, by QI/comparison area in each cadre. Panel A—Midlevel care providers. Panel B—HEWs. Panel C—Non-patient-facing staff. Notes: In each panel, the vertical axis shows the mean motivational score. Statistically meaningful motivational scores between baseline and endline are indicated on the horizontal axis, where *** denotes P-value < 0.01. Overall motivation refers to the question: ‘How would you rate your overall motivation at your current work?’.