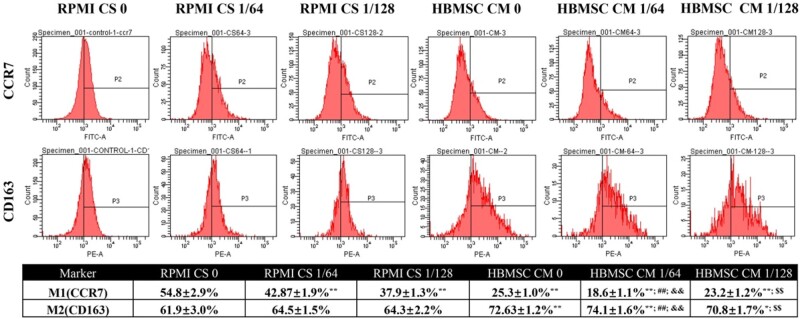
Figure 5.
Flow cytometry results of macrophages cultured with different medium. *P < 0.05 and **P < 0.01 when compared with the data of RPMI CS 0. ##P < 0.01 when compared with the data of HBMSC CM 0. &&P < 0.01 when compared with the data of RPMI CS 1/64. $$P < 0.01 when compared with the data of RPMI CS 1/128

