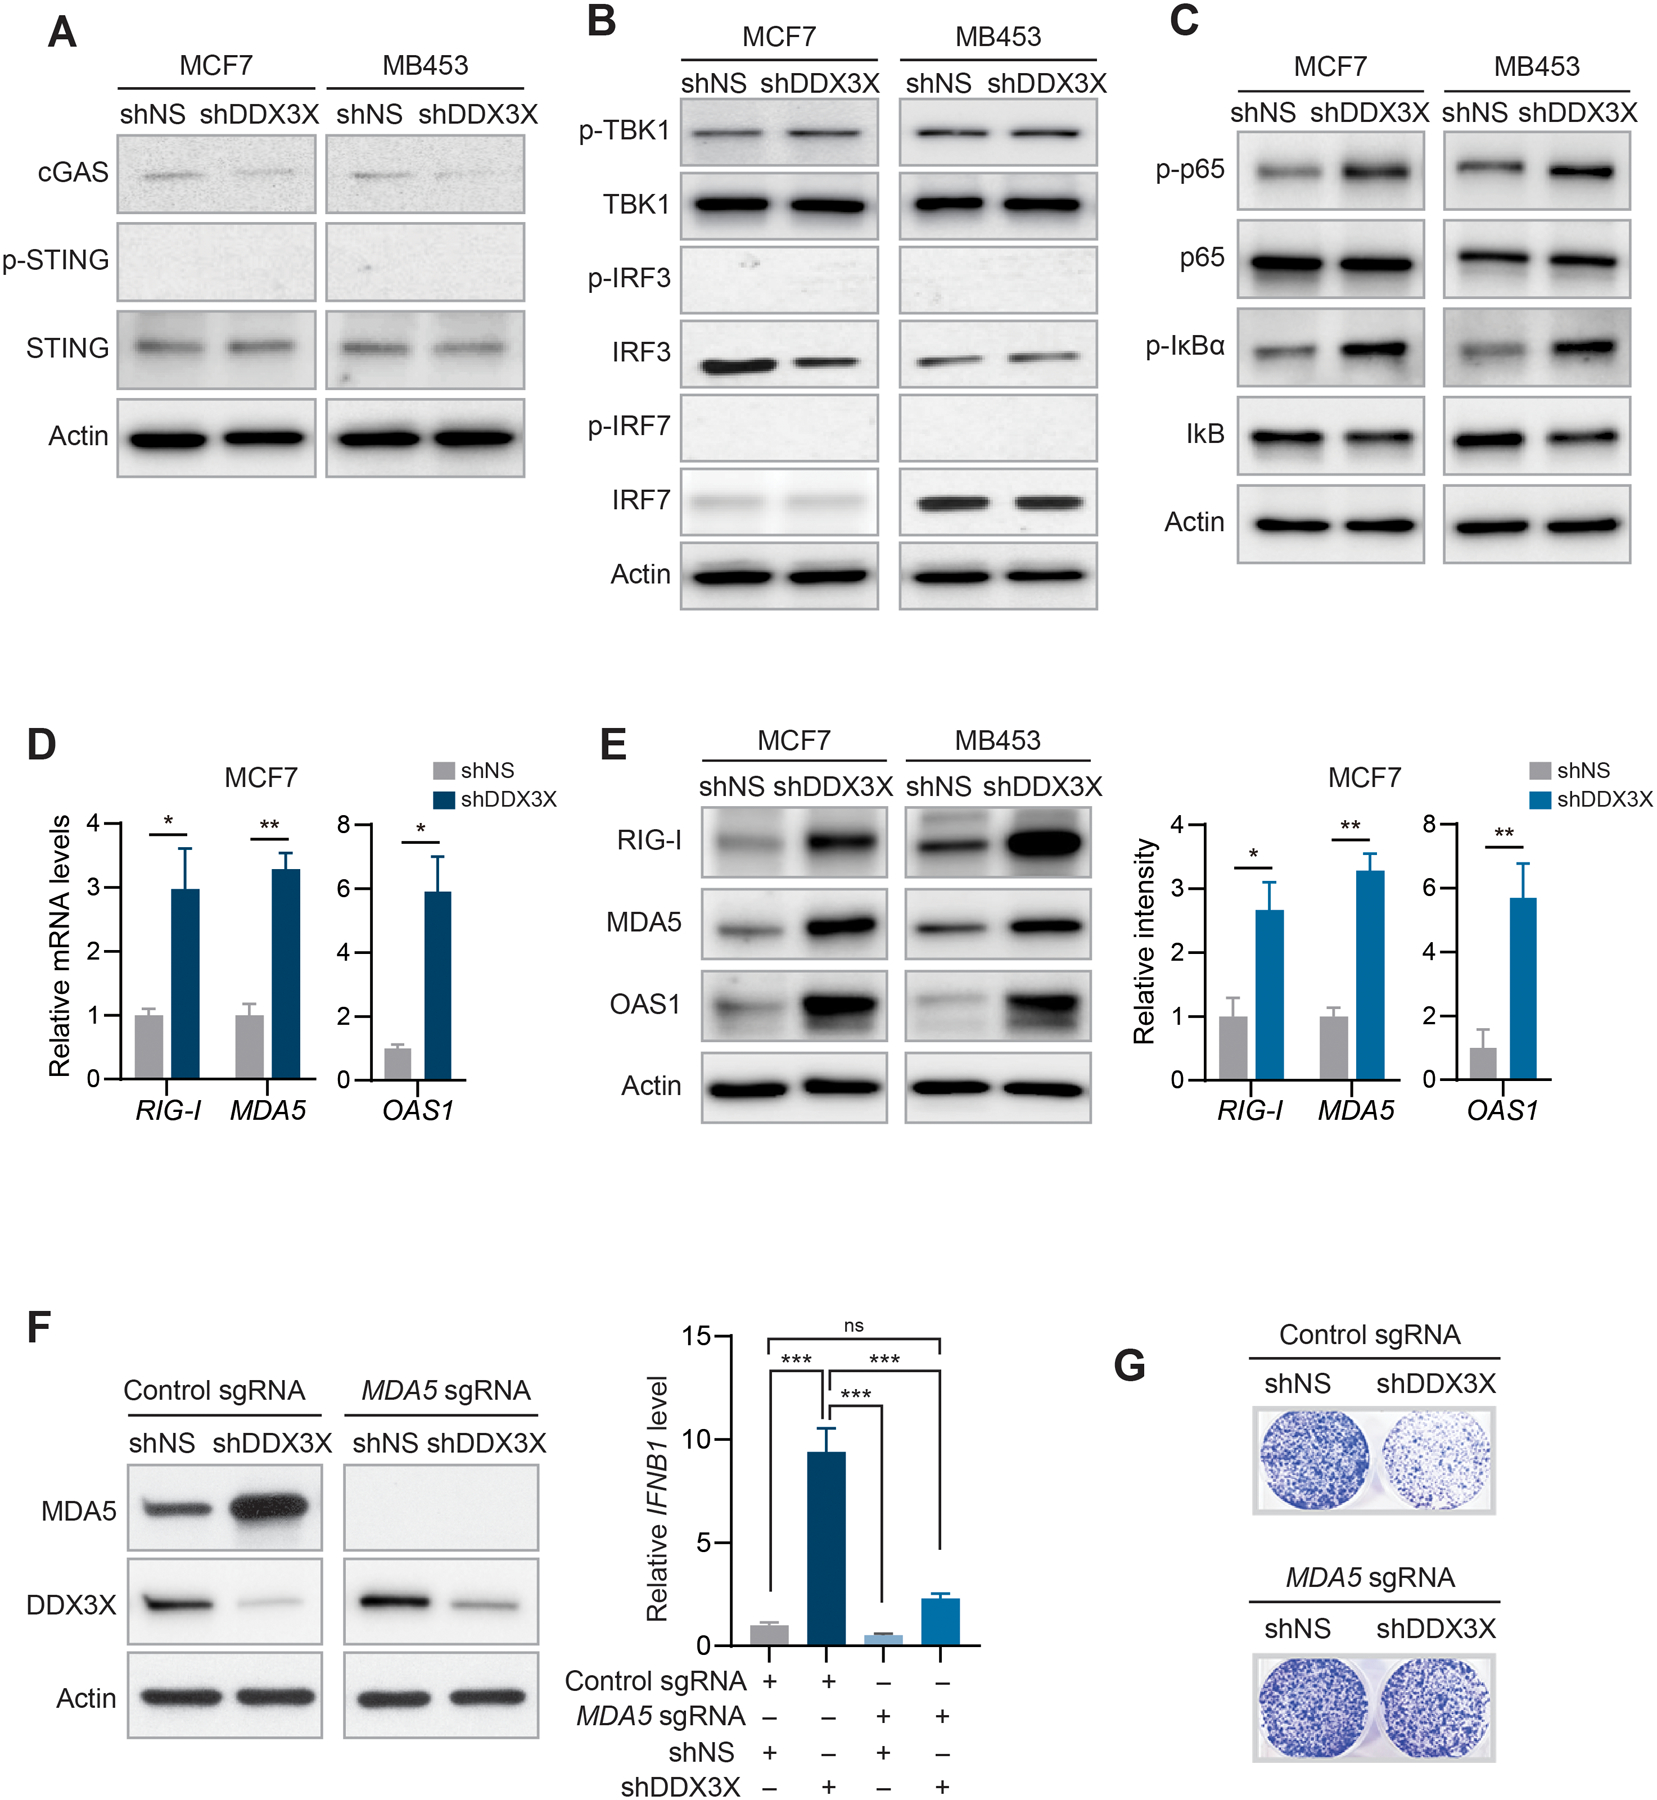
Figure 3. dsRNA sensing MDA5-NFκB signaling axis leads to type I IFN production in DDX3X-depleted breast cancer cells.

A. Western blot analysis of STING, phosphorylation of STING, and cGAS in DDX3X-control or -KD MCF7 or MDA-MB-453 cells.
B. Western blot analysis of phosphorylation of TBK1, IRF3, and IRF7 in DDX3X-control or -KD MCF7 or MDA-MB-453 cells.
C. Western blot analysis of phosphorylation of NFκB p65 and IκBα in DDX3X-control or -KD MCF7 or MDA-MB-453 cells.
D. qRT-PCR of RIG-I, MDA5, and OAS1 in DDX3X-control or KD-MCF7 cells.
E. Western blot analysis of RIG-I, MDA5, and OAS1 in DDX3X-control or -KD MCF7 or MDA-MB-453 cells (left). Bar graphs of relative protein band intensity (right).
F. Western blot validation of CRISPR/Cas9-mediated MDA5 knockout (KO) in DDX3X-control or -KD MCF7 cells (left). qRT-PCR of IFNB1 in MDA5 wildtype or KO cells followed by DDX3X-control or -KD.
G. Colony formation assay in CRISPR/Cas9-mediated MDA5-KO MCF7 cells followed by DDX3X-control or -KD.
Data are shown as mean ± SEM of three independent experiments. Statistical significance was calculated using unpaired t-tests (Fig. 3D and 3E) or one-way ANOVA with uncorrected Fisher’s LSD test (Fig. 3F). *p < 0.05; **p< 0.01.
