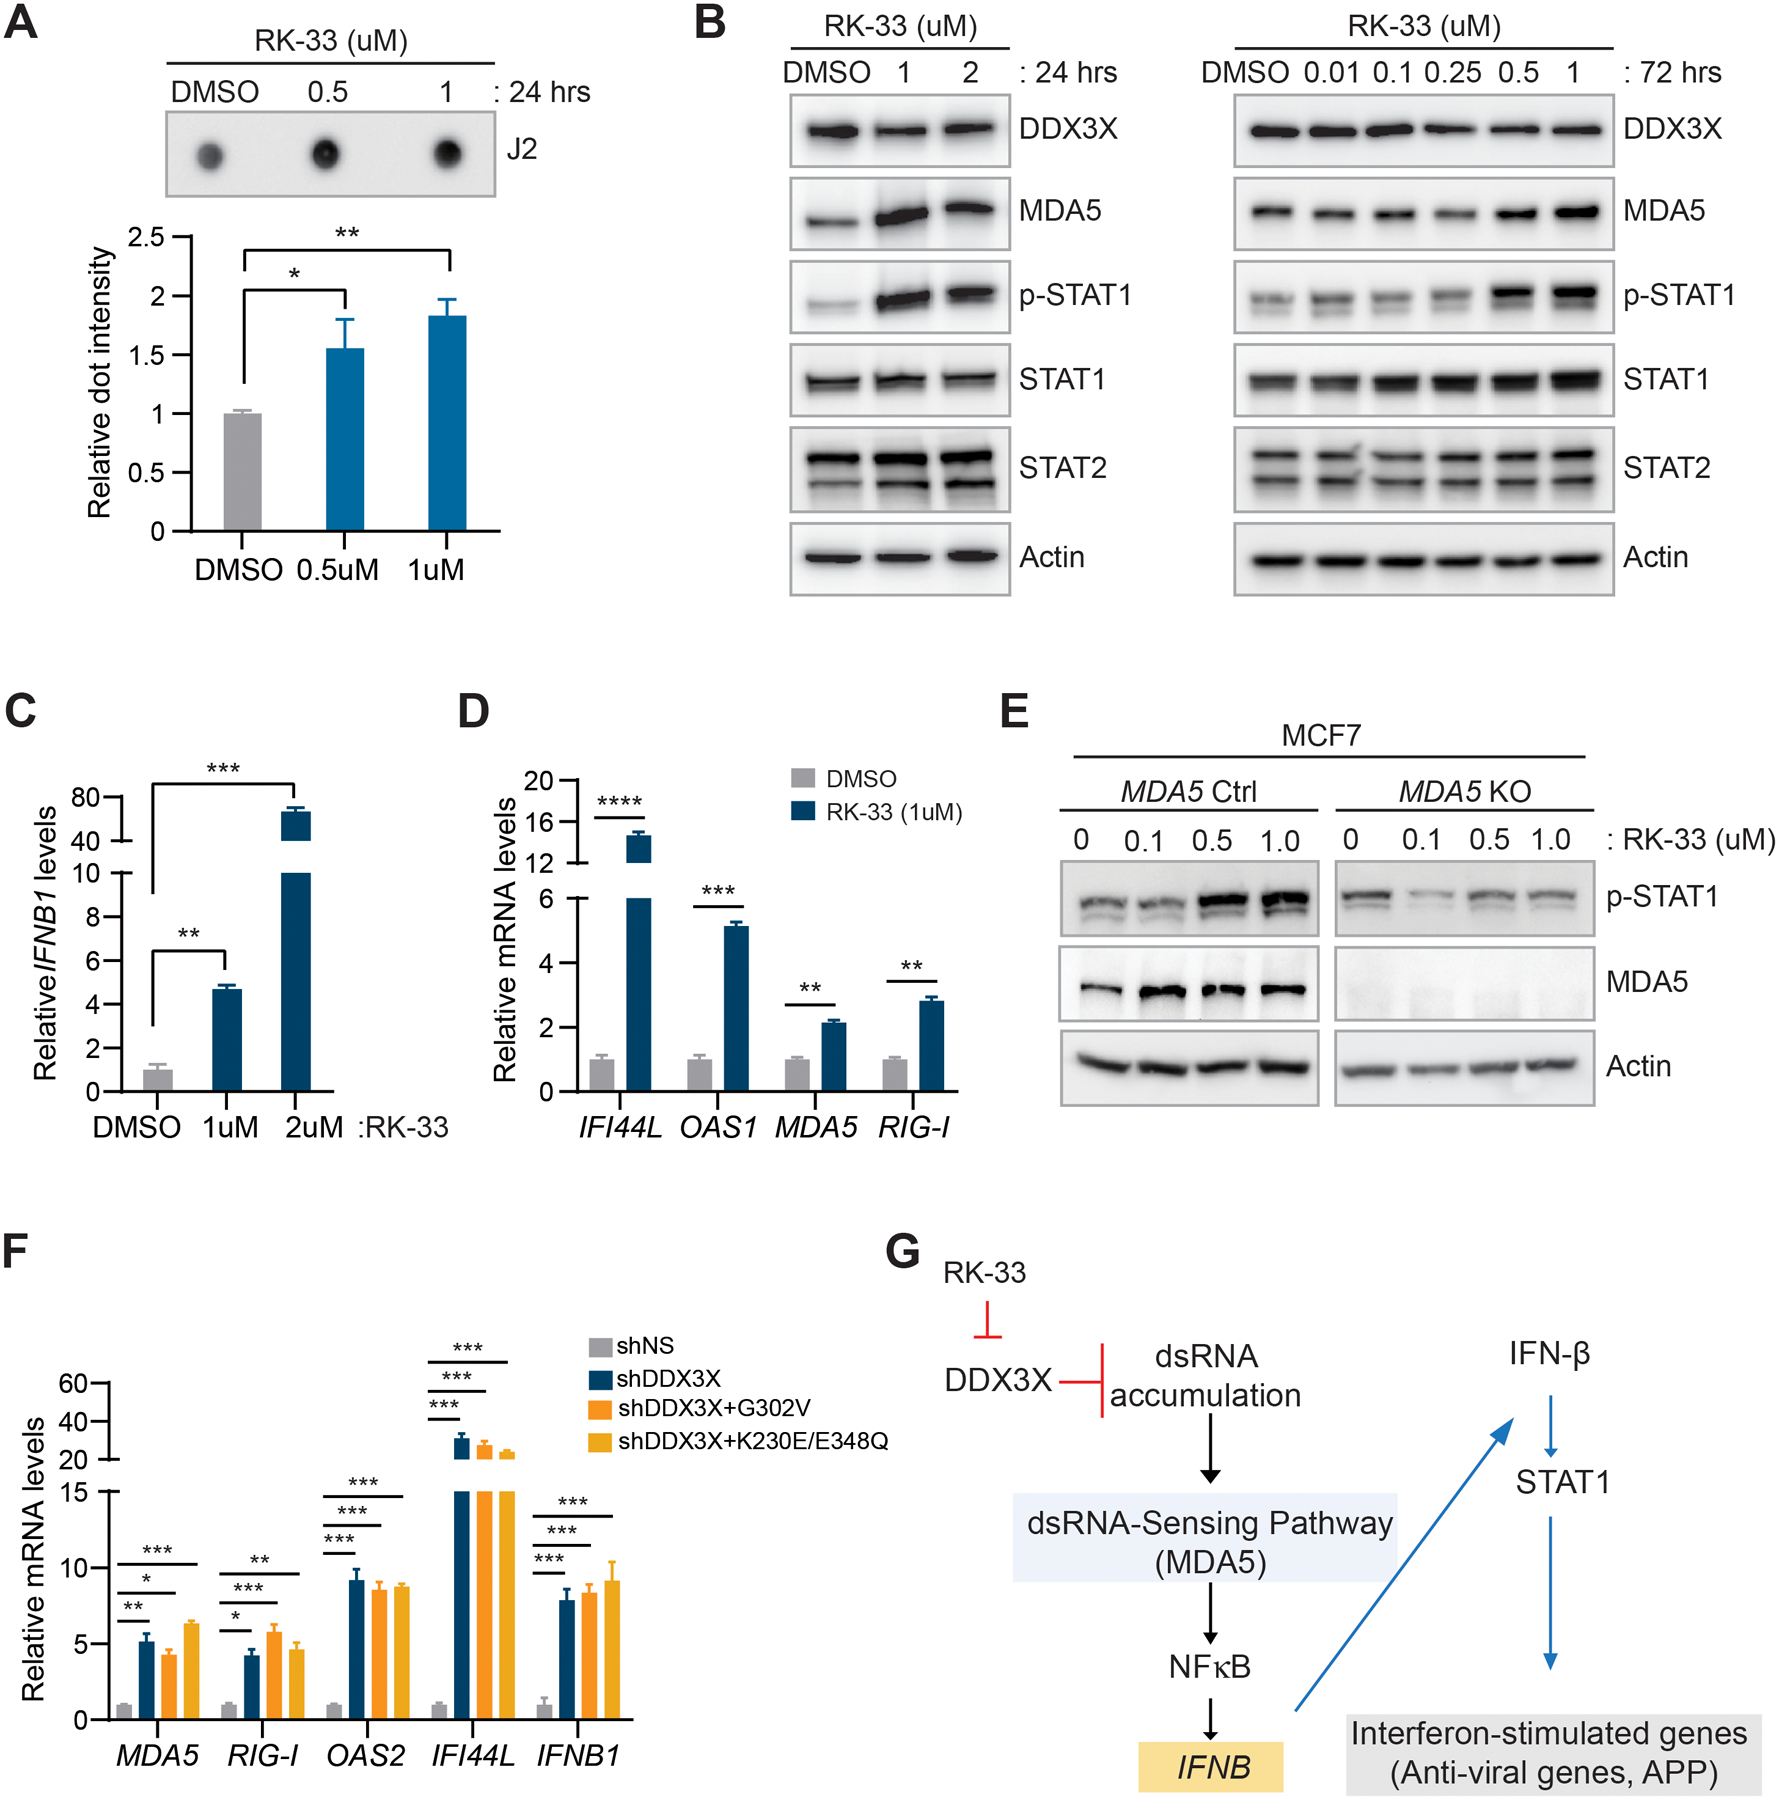
Figure 5. DDX3X helicase activity is critical for preventing accumulation of dsRNAs and dsRNAs-mediated type I IFN activation.

A. J2 dot blot analysis with total RNAs extracted from MCF7 cells treated with RK-33 for 24 hours. A bar graph shows relative dsRNA dot intensity.
B. Western blot analysis in RK-33 treated MCF7 cells (24 hours and 72 hours).
C. qRT-PCR of IFNB1 in RK-33 treated MCF7cells (72 hours).
D. qRT-PCR of ISGs in RK-33 treated MCF7 cells (72 hours).
E. Western blot analysis of MDA5 and phospho-STAT1 in MDA5 KO MCF7 cells followed by RK-33 treatment (24 hours).
F. qRT-PCR of ISGs in DDX3X-KD MCF7 cells followed by overexpression of DDX3X mutants (G302V and K230E/E348Q).
G. Schema of the activation of dsRNA-mediated type I IFN signaling in DDX3X-KD or DDX3X-inhibited (RK-33) cancer cells.
Data are shown as mean ± SEM of three independent experiments. Statistical significance was calculated using unpaired t-tests (Fig. 5A, 5C, and 5D) or one-way ANOVA with uncorrected Fisher’s LSD test (Fig. 5F). *p < 0.05; **p< 0.01; ***p < 0.001; ****p < 0.0001; ns, not significant.
