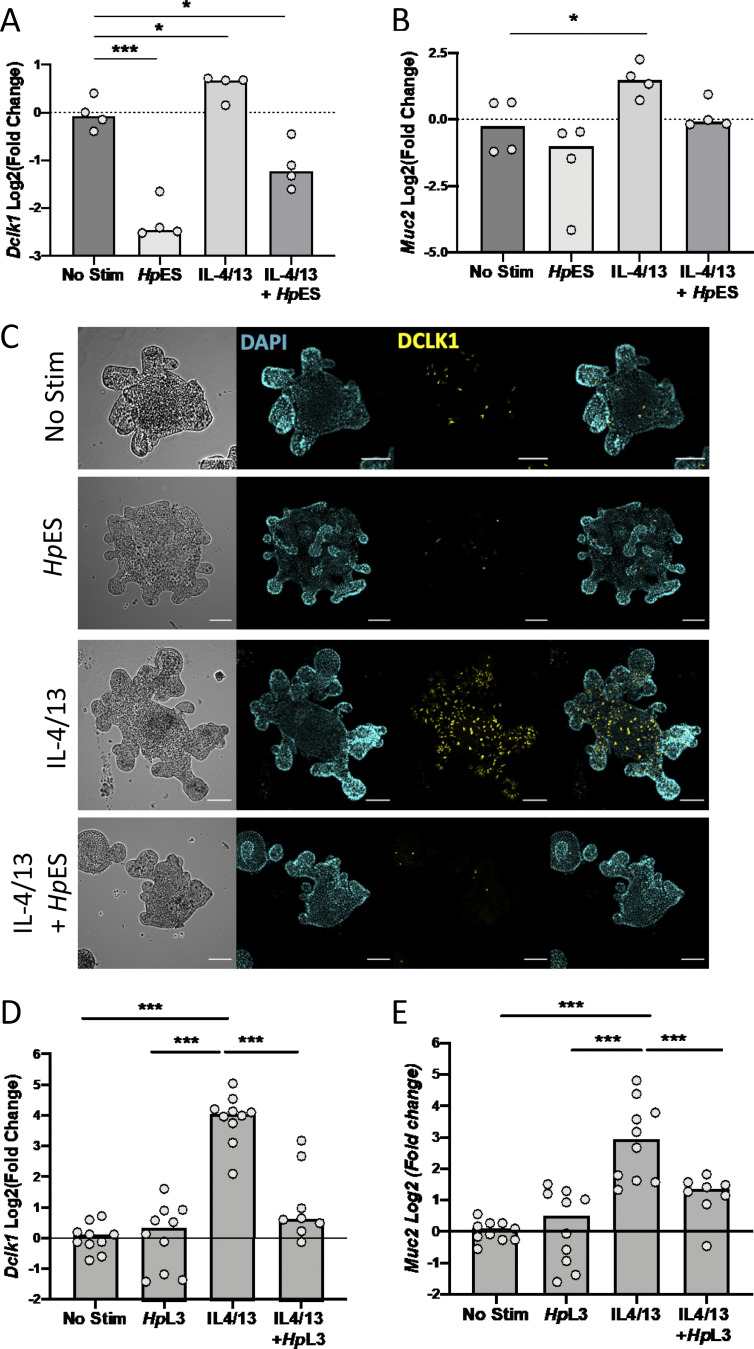
Figure 3.
HpES and H. polygyrus larvae repress tuft cell expansion in small intestinal organoids. (A and B) Expression of canonical tuft cell and goblet cell genes in organoids treated with combinations of IL-4/13, HpES, or neither. Log2 fold change of qRT-PCR values for Dclk1 and Muc2 compared with nonstimulated control in four independent biological replicates analyzed by RNA-seq. Statistical analysis was by ordinary one-way ANOVA with Tukey’s multiple comparisons test. *, P < 0.05; ***, P < 0.001. (C) Representative images of organoids stained for tuft cells (anti-DCLK1), shown in yellow, in in organoids treated with combinations of IL-4/13, HpES, or neither. Nuclear staining (DAPI) shown in cyan. Scale bar is 100 µm. (D and E) Expression of Dclk1 and Muc2 in H. polygyrus L3 larvae exposed organoids, Log2 fold change of qRT-PCR values shown compared with nonstimulated control. Data are pooled from four experiments each with two to four replicates, total n = 8–10 per group. Statistical analysis was by ordinary one-way ANOVA with Tukey’s multiple comparisons test. *, P < 0.05; ***, P < 0.001. Stim, stimulation.

