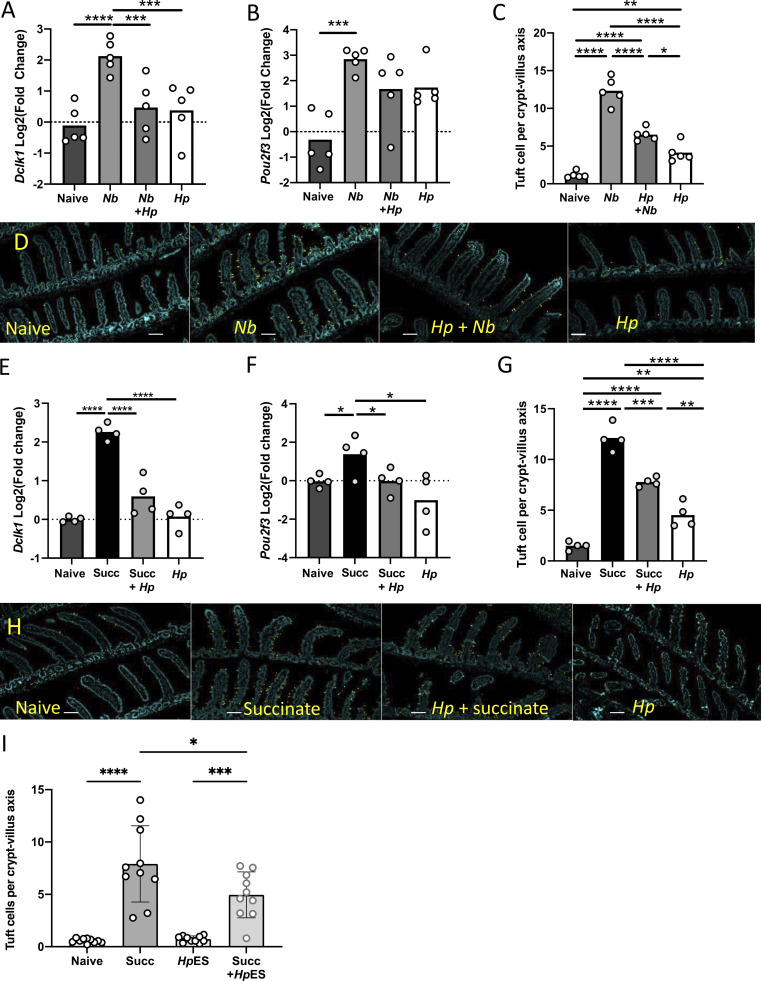
Figure 4.
H. polygyrus inhibits tuft cell expansion in vivo. Mice were infected with 200 H. polygyrus L3 for 28 d before infection with N. brasiliensis for 7 d (A–D) or treatment with 100 mM succinate in drinking water for 7 d. Intestinal tissues were taken at day 7 for mRNA isolation and immunohistological analysis. (A and B) Expression of canonical tuft cell genes Dclk1 (A) and Pou2f3 (B) measured by qRT-PCR in intestinal samples taken from the singly and coinfected mice, presented as log2 fold change compared with uninfected controls. Statistical analysis was by ordinary one-way ANOVA with Tukey’s multiple comparisons test. Data are from one of three replicate experiments, each with four or five mice per group. ***, P < 0.001; ****, P < 0.0001. (C and D) Tuft cell counts (C) and representative images of tuft cell staining (D) in singly and coinfected mice. Scale bar is 100 µm. Tuft cell counts from ≥20 villus/crypt units were averaged per mouse, and the means for each of five mice per group are presented. Experiments were performed three times with similar results, and data from one representative experiment are shown. Kruskal–Wallis test with Dunn’s multiple comparisons test was used as the discrete data gathered will not be normally (Gaussian) distributed. *, P < 0.05; ****, P < 0.0001. (E and F) Expression of canonical tuft cell genes Dclk1 (E) and Pou2f3 (F) measured by qRT-PCR in intestinal samples taken from succinate and H. polygyrus–infected mice, presented as log2 fold change compared with untreated and uninfected controls. Statistical analysis was by ordinary one-way ANOVA with Tukey’s multiple comparisons test. Data are from one of two replicate experiments, each with four mice per group. *, P < 0.05; ****, P < 0.0001. (G and H) Tuft cell counts (G) and representative images of tuft cell staining (H) from succinate-treated mice. Scale bar is 100 µm. Tuft cell counts are given as mean for each of four mice per group. Data are from one of two replicate experiments, each with four mice per group. Kruskal–Wallis test with Dunn’s multiple comparisons test was used. **, P < 0.01; ***, P < 0.001; ****, P < 0.0001. (I) Tuft cell counts from mice administered with succinate and/or HpES; 5 µg HpES was given at days −1, 0, +1, +2, +3 and +4, i.p. Results are pooled from two independent experiments each with five mice per group. Kruskal–Wallis test with Dunn’s multiple comparisons test was used. *, P < 0.05; ***, P < 0.001; ****, P < 0.0001. Hp, H. polygyrus; Nb, N. brasiliensis; Succ, succinate.

