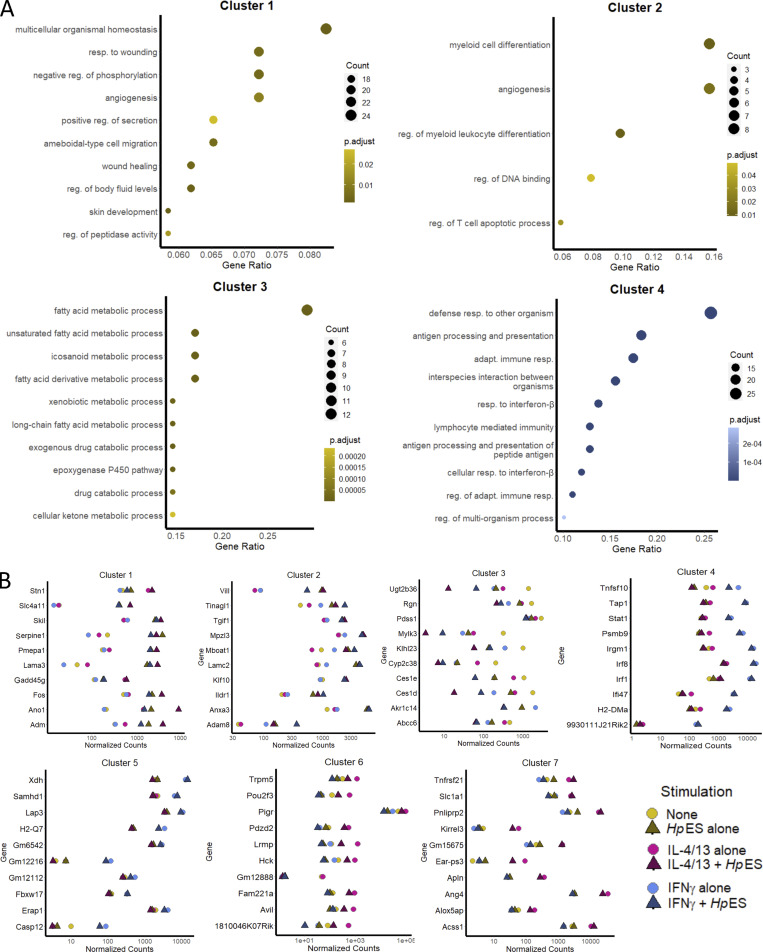
Figure S2.
Cluster analysis of HpES modulated gene expression. (A) Top 5 or 10 GO terms by gene ratio for each cluster. Only clusters 1–4 were identified as having corresponding GO terms using enrichGO from ClusterProfiler, and only five GO terms were returned for cluster 2. Redundant GO terms were removed using ReViGO before plotting. (B) Mean normalized counts for the top 10 genes from each cluster by P-adjusted values. Adapt., adaptive; reg., regulation; resp., response.

