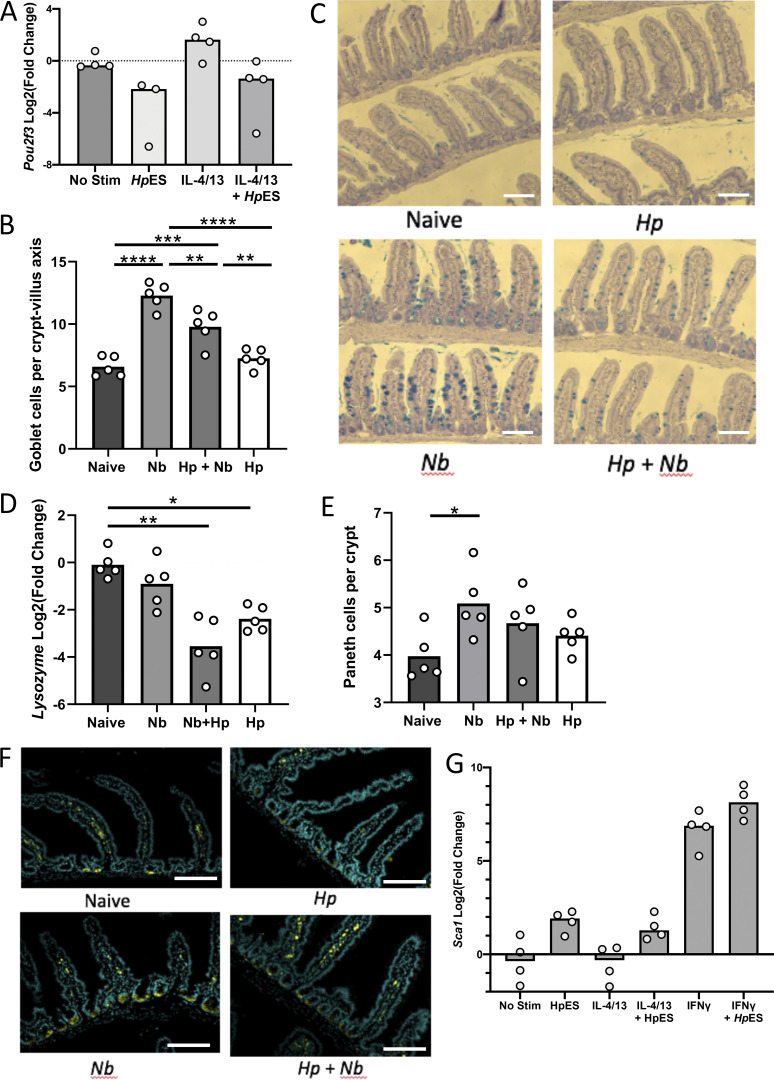
Figure S3.
Cell type–specific inhibition by HpES and H. polygyrus. (A) Pou2f3 gene expression in HpES and IL-4/13 treated organoids. Log2 fold change shown compared with nonstimulated control in four separate biological repeats analyzed in parallel by RNA-seq. (B) Goblet cell counts in mice singly or coinfected with H. polygyrus and/or N. brasiliensis, counted villus tip to tip after periodic acid–Schiff staining; 25 counts villus-crypt units were analyzed per mouse. Data are from one experiment with four mice per group, representative of three similar experiments. Kruskal–Wallis test with Dunn’s multiple comparisons test was used; **, P < 0.01; ***, P < 0.001; ****, P < 0.0001. (C) Representative images of goblet cell staining using periodic acid–Schiff staining. Scale bar is 100 µm. (D) Lysozyme gene expression in intestinal samples. Data are from one experiment with four mice per group, representative of three similar experiments. Ordinary one-way ANOVA with Tukey’s multiple comparisons test was used; *, P < 0.05; **, P < 0.01. (E) Paneth cell counts, number of cells per crypt after staining with anti-lysozyme. Data are from one experiment with four mice per group, representative of three similar experiments. Kruskal–Wallis test with Dunn’s multiple comparisons test was used; *, P < 0.05. (F) Representative images of Paneth cell staining with anti-lysozyme. Scale bar is 100 µm. (G) Expression of Sca1 from organoid cultures under the indicated conditions. Change shown compared with nonstimulated control in four independent biological replicates analyzed in parallel by RNA-seq. Hp, H. polygyrus; Nb, N. brasiliensis; Stim, stimulation.

