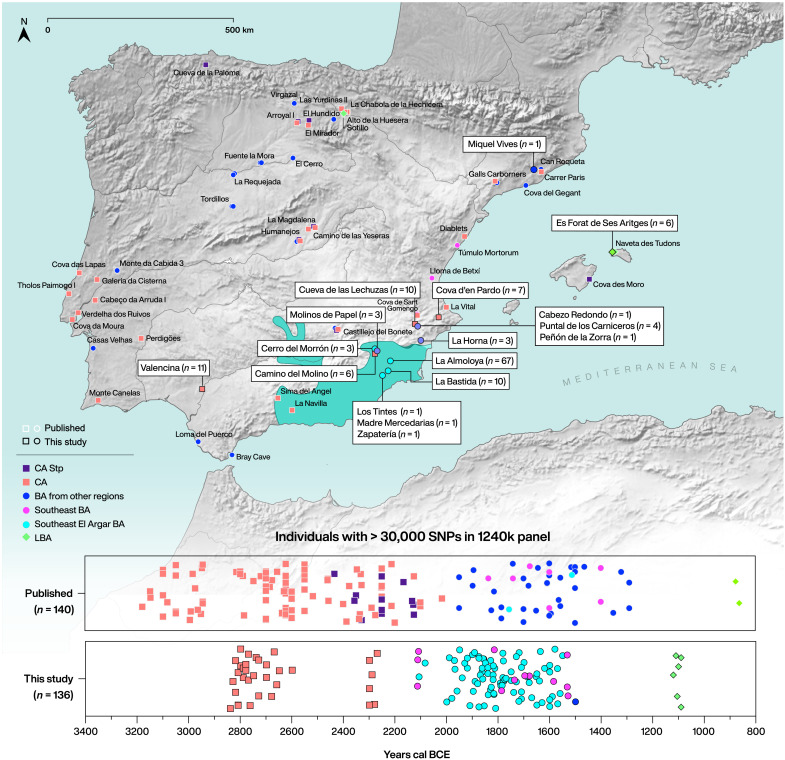
Fig. 1. Geographic locations as well as cultural and chronological information of the studied sites.
Map of Iberia with sites mentioned in the main text (table S1.1). The area shaded in teal highlights the maximum extent of EBA El Argar. Chronological time scale for published and new individuals analyzed in this study (bottom panel). Directly radiocarbon-dated individuals are plotted according to their mean calibrated date (2-sigma range), and jitter option within their specific time range was applied for individuals that were dated by archaeological context (table S2.1). Random jitter was applied to the Y axis to prevent overplotting.

