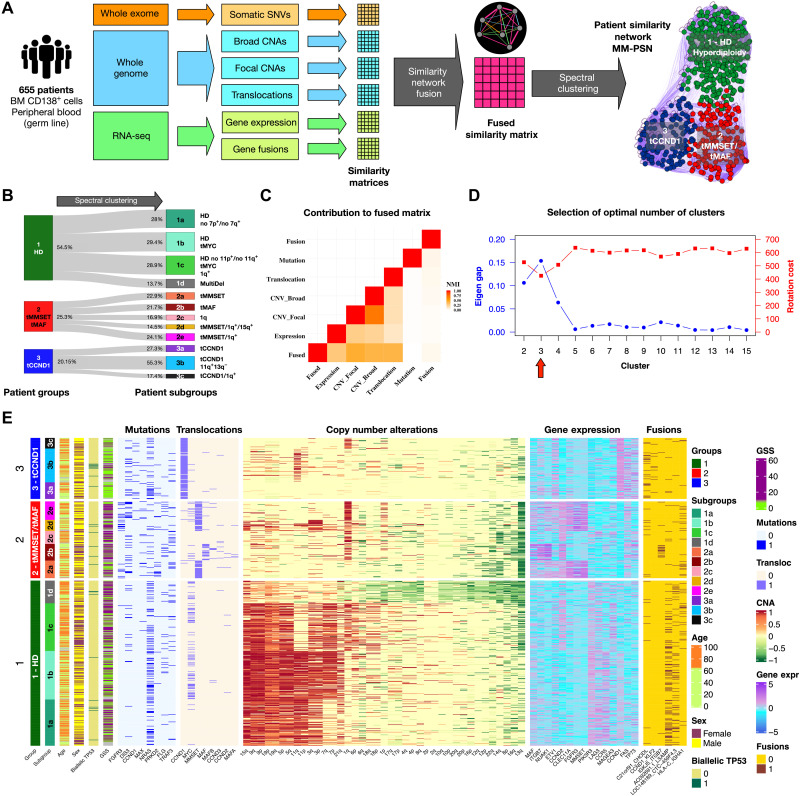
Fig. 1. Network generation and identification of groups and subgroups.
(A) Somatic genetic variants and transcriptomic features from WES, WGS, and RNA-seq data from 655 patients in the MMRF CoMMpass study was used to generate an MM-PSN using the SNF approach. Edges connecting patients in the network represent similarity based on one or more feature type (e.g., orange edges in the sample network represent similarity based on SNVs and magenta edges represent similarity based on all the types of features). Spectral clustering was used to identify patient groups and then reapplied to identify subgroups enriched for specific features. (B) Representation of MM-PSN where nodes (patients) are colored according to the three main groups identified by spectral clustering. (C) The plot shows the contribution of the different data types to the fused matrix, in terms of normalized mutual information (NMI). (D) Eigen gap (maximum) and rotation cost (minimum) were used to determine 3 as the optimal number of clusters. (E) Overview of MM-PSN patient groups and subgroups. The heatmap shows characterization of the three main groups and 12 subgroups of MM-PSN based on their enrichment for the different genomic and transcriptomic features. GSS, genomic scar score.

