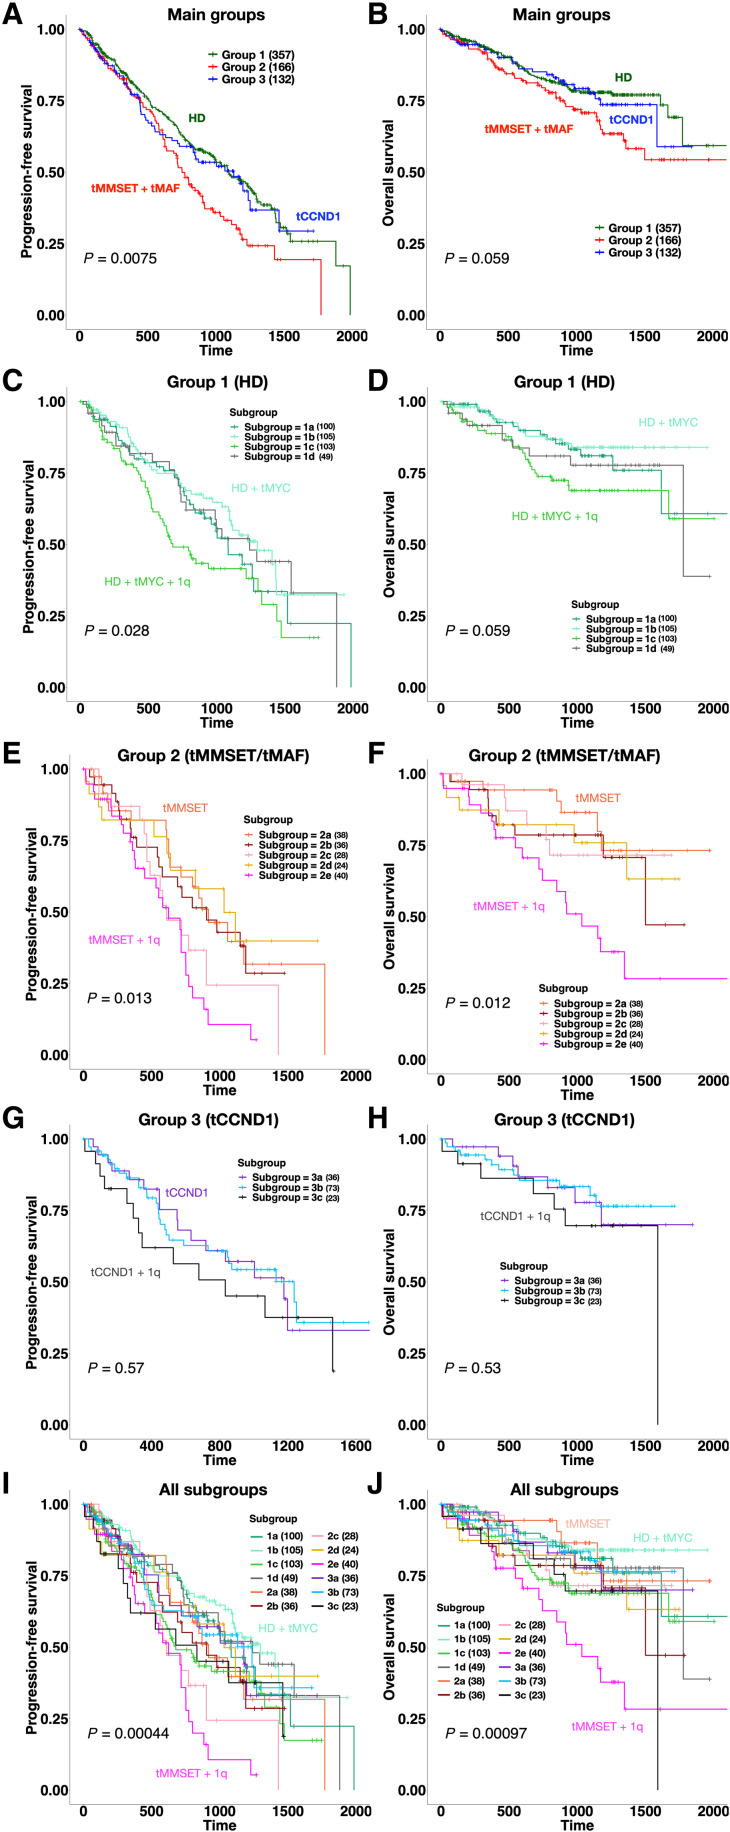
Fig. 2. Survival analysis of MM-PSN identifies high-risk subgroups.
(A and B) PFS and OS plots for the three main patient groups identified by MM-PSN, showing significant poorer outcome for the tMMSET + tMAF group. (C and D) Survival plots for subgroups of group 1 show shorter PFS in patients from subgroup 1C characterized by HD, tMYC, and 1q gain, compared to patients in subgroup 1B, which do not have 1q gain. (E and F) Survival plots for subgroups of group 2 show shorter PFS and OS in patients from subgroup 2E, enriched for tMMSET and 1q gain. (G and H) Survival plots for subgroups of group 3 do not show significant differences in either PFS or OS. (I and J) Survival plots for all 12 subgroups of MM-PSN, indicating poorer outcome of patients in subgroup 2e. P values were calculated using the log-rank test.

