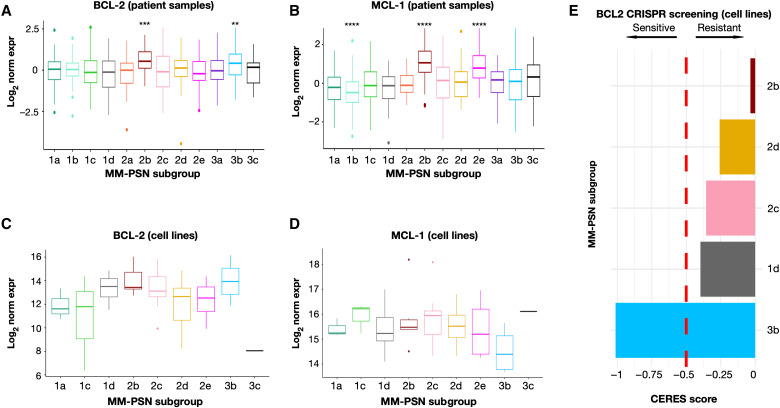
Fig. 7. BCL2 and MCL1 expression in patients and cell lines identifies subgroups at increased sensitivity and resistance to venetoclax.
(A to D) Gene expression profile of BCL2 and MCL1 across MM-PSN subgroups in patients and cell lines suggests sensitivity to venetoclax in subgroup 3b (high BCL2 and low MCL1) and resistance in subgroup 2b (high BCL2 and high MCL1). (E) CRISPR screening indicates increased essentiality of BCL2 in cell lines associated with subgroup 3b and decreased essentiality in subgroup 2b, supporting sensitivity and resistance to venetoclax, respectively. CERES score < −0.5 indicates essentiality. P values were calculated using the Wilcoxon rank sum test. **P < 0.01, ***P < 0.001, and ****P < 0.0001.

