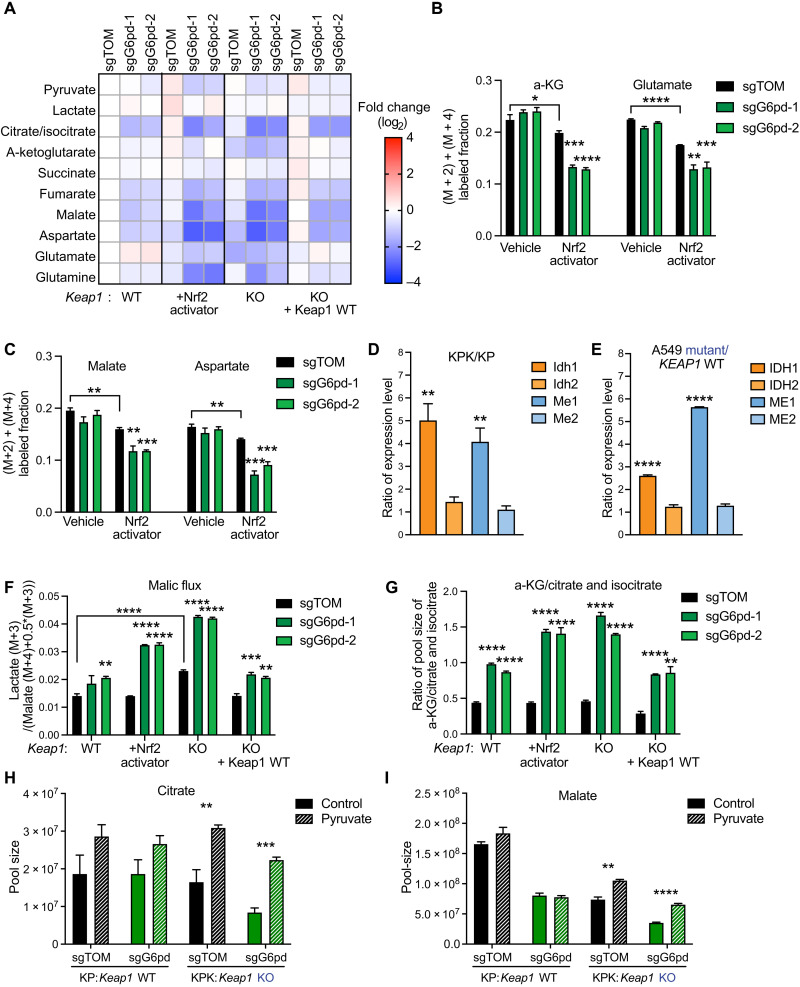
Fig. 3. G6PD disruption leads to an impairment of central carbon metabolism.
(A) Heatmap of TCA cycle metabolite pool sizes in KP, KP + Nrf2 activator, KPK + Keap1 WT cDNA, and KPK + vector cells with G6pd KO. Data were normalized to KP sgTOM group and calculated as log2(fold change) (n = 3). (B and C) Mass isotopomer analysis of TCA cycle metabolites (malate, aspartate, a-KG, and glutamate) in KP and KP + KI cells cultured for 1.5 hours with U-13C-glucose (n = 3). (D) Quantitative PCR (qPCR) validation of Idh1, Idh2, Me1, and Me2 expression in KP/KPK cells. Data of mRNA expression were normalized to actin and then calculated as the ratio of Keap1 KO/Keap1 WT (n = 4). (E) qPCR validation of IDH1, IDH2, ME1, and ME2 expression in A549 + KEAP1 WT /A549 + vector cells. Data of mRNA expression were normalized to ACTIN and then calculated as the ratio of KEAP1 mutant/KEAP1 WT (n = 4). (F) Malic flux/glycolysis of KP, KP + Nrf2 activator, KPK + vector cells, and KPK + Keap1 WT with G6pd KO. Flux is calculated as (lactate M + 3) / (malate (M + 4) + 0.5*malate (M + 3)) of 3-hour U-13C-glutamine tracing (n = 3). (G) Idh activity of KP, KP + Nrf2 activator, KPK + vector, and KPK + Keap1 WT cells with G6pd KO. Proxy Idh activity was calculated by a-KG/citrate and isocitrate pool-size ratio and then normalized to KP sgTOM (n = 3). (H and I) Pool sizes (TIC) of citrate (H) and malate (I) in KP and KPK sgTOM or sgG6pd cells cultured for 2 days with 2 mM pyruvate (n = 3), data measured by LC-MS. *P < 0.05, **P < 0.01, ***P < 0.001, and ****P < 0.0001.

