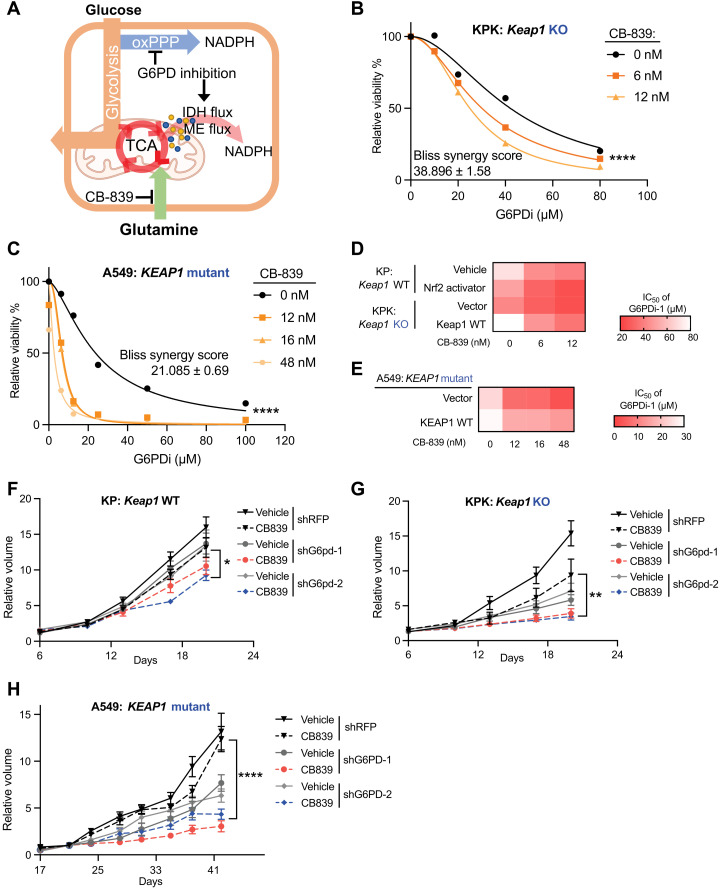
Fig. 5. Inhibition of G6PD and glutaminase synergize to attenuate KEAP1 mutant LUAD.
(A) Schematic of G6PD inhibition corporation with glutaminase inhibitor to repress cell glucose metabolism and respiration. (B) Relative viability of KPK (Keap1 KO) cells cultured with 0, 6, and 12 nM CB-839 and treated with G6PDi-1 for 3 days. Data were normalized to CB-839 0 nM and G6PDi-1 vehicle group (n = 4). (C) Relative viability of A549 (KEAP1 mutant) cells cultured with 0, 12, 16, and 48 nM CB-839 and treated with G6PDi-1 for 3 days. Data were normalized to CB-839 0 nM and G6PDi-1 vehicle group (n = 3). (D) Heatmap of KP, KP + Nrf2 activator, KPK + vector, and KPK + Keap1 WT cells median inhibitory concentration (IC50) of G6PDi-1 in different CB-839 treatment. (E) Heatmap of A549 + vector and A549 + KEAP1 WT cells IC50 of G6PDi-1 in different CB-839 treatment. (F) Relative tumor growth of subcutaneous KP (Keap1 WT) tumors with hairpin against G6pd in animals treated with either CB-839 or vehicle. Data were normalized to first measurement at day 6 (n = 6). (G) Relative tumor growth of subcutaneous KPK (Keap1 KO) tumors with hairpin against G6pd in animals treated with either CB-839 or vehicle. Data were normalized to first measurement at day 6 (n = 6 for shRFP and shG6pd-1 and n = 8 for shG6pd-2). (H) Relative tumor growth of subcutaneous A549 (KEAP1 mutant) tumors with hairpin against G6PD in animals treated with either CB-839 or vehicle. Data were normalized to second measurement at day 21 (n = 6). *P < 0.05, **P < 0.01, and ****P < 0.0001. Detailed statistics analysis of (F) to (H) is presented in table S3.

