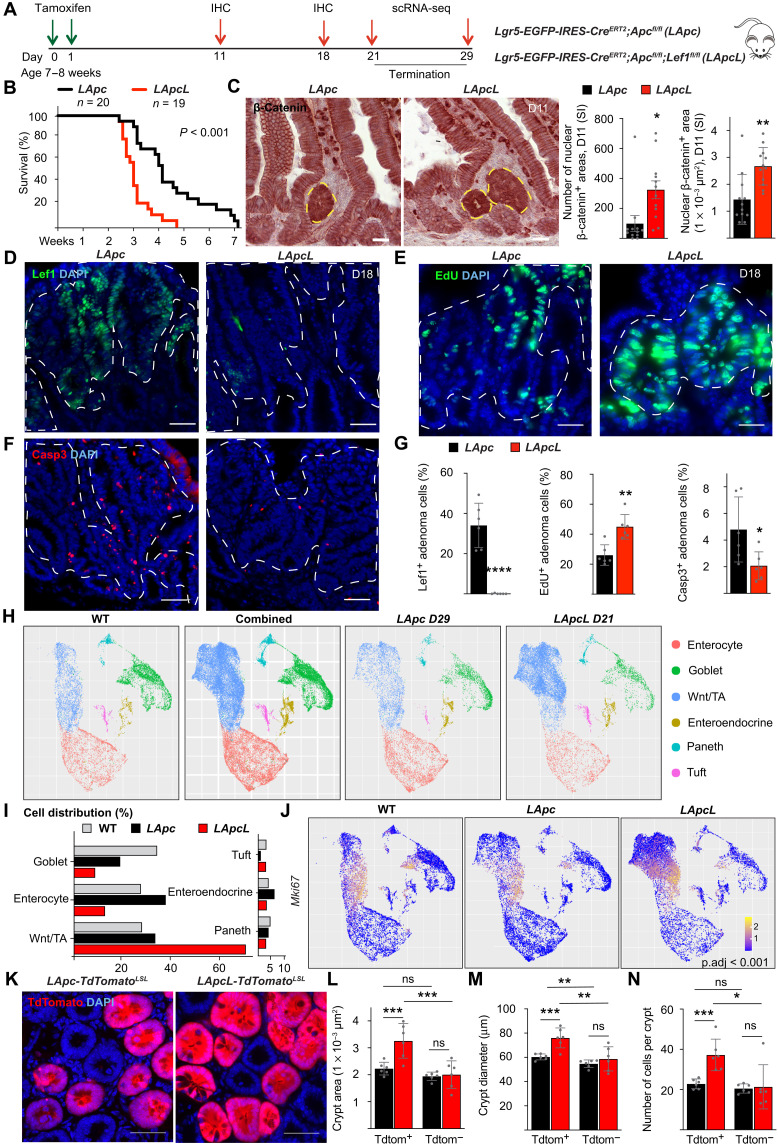
Fig. 2. Lef1 deletion increases tumor initiation and growth in Apc-mutant adenomas.
(A) Schematic of the experiment. IHC, immunohistochemistry. (B) Kaplan-Meier survival curves of the LApc (n = 20) and LApcL (n = 19) mice. (C) Staining and quantification (means ± SEM) of nuclear β-catenin+ area in the small intestine (SI) 11 days after gene deletion. Scale bars, 100 μm. n = 12 per group, *P < 0.05 and **P < 0.01. (D to G) Immunostaining and quantification (means ± SD) of the percentage of (D and G) Lef1+, (E and G) EdU+, and (F and G) Casp3+ adenoma cells 18 days after gene deletion. Scale bars, 50 μm. n = 6 per group, *P < 0.05, **P < 0.01, and ****P < 0.001. (H) UMAP visualization of scRNA-seq results from epithelial cellular adhesion molecule (EpCAM)+ intestinal cells of the WT, LApc, and LApcL mice at days 29 and 21, respectively. (I) Cell distribution percentages in the indicated scRNA-seq clusters of WT, LApc, and LApcL cells. (J) Mki67 RNA expression in WT, LApc, and LApcL epithelial cells. Adjusted P value (p.adj) indicates the significance of the Mki67 expression in the LApcL versus LApc adenoma cells. (K) Representative images of LApc-TdTomatoLSL and LApcL-TdtomatoLSL crypts. Scale bars, 50 μm. (L to N) Quantification of the (L) crypt area, (M) crypt diameter, and (N) crypt cell number of LApc-TdtomatoLSL and LApcL-TdTomatoLSL intestines. n = 6 per group, *P < 0.05, **P < 0.01, and ***P < 0.005. The dashed lines in (C) to (F) indicate the nuclear β-catenin+ adenoma cell area. ns, not significant.

