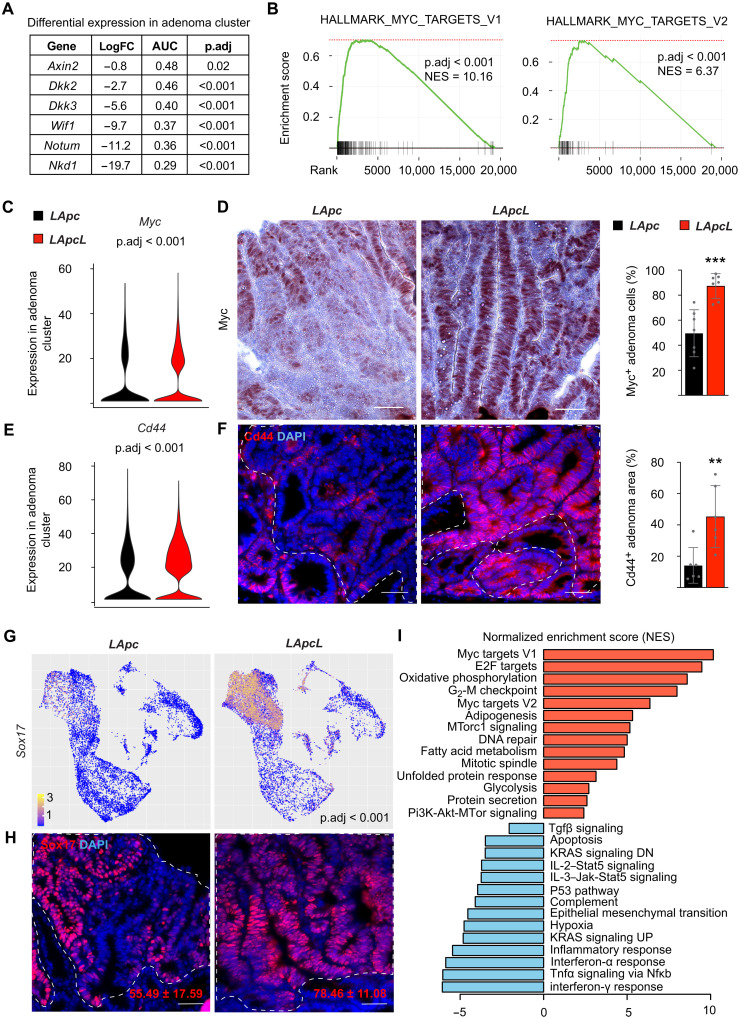
Fig. 3. Lef1 deletion decreases expression of Wnt antagonists but increases Myc and Cd44.
(A) Differential gene expression analysis of Wnt antagonists Nkd1, Notum, Wif1, Dkk3, Dkk2, and Axin2 in LApcL versus LApc adenoma cluster. LogFC, log fold change. (B) GSEA of MSigDB’s Myc signaling Hallmark gene sets in the LApcL versus LApc adenoma cluster. NES, normalized enrichment score. (C) Myc expression based on scRNA-seq analysis of the LApc and LApcL adenoma cluster. (D) Myc immunostaining and quantification of Myc+ cells in LApc and LApcL tumor sections 18 days after gene deletion. Scale bars, 50 μm. n = 6 per group, ***P < 0.005. (E) Cd44 expression based on scRNA-seq analysis of the LApc and LApcL adenoma cluster. (F) Cd44 immunostaining and quantification in LApc and LApcL adenoma cells 18 days after gene deletion. Scale bars. 50 μm; n = 6 per group, **P < 0.01. (G) Sox17 expression based on scRNA-seq analysis of the LApc and LApcL adenoma clusters. (H) Sox17 immunostaining and quantification in LApc and LApcL adenoma cells 18 days after gene deletion. Scale bars, 50 μm. n = 6 per group. (I) GSEA analysis showing selected MSigDB’s Hallmark pathways, which are significantly (P < 0.05) enriched in the LApcL versus LApc adenoma cluster. The dashed lines indicate nuclear β-catenin+ adenoma areas. Tnfa, tumor necrosis factor–α; Nfκb, nuclear factor κB; Jak, Janus kinase; Stat5, signal transducers and activators of transcription 5.

