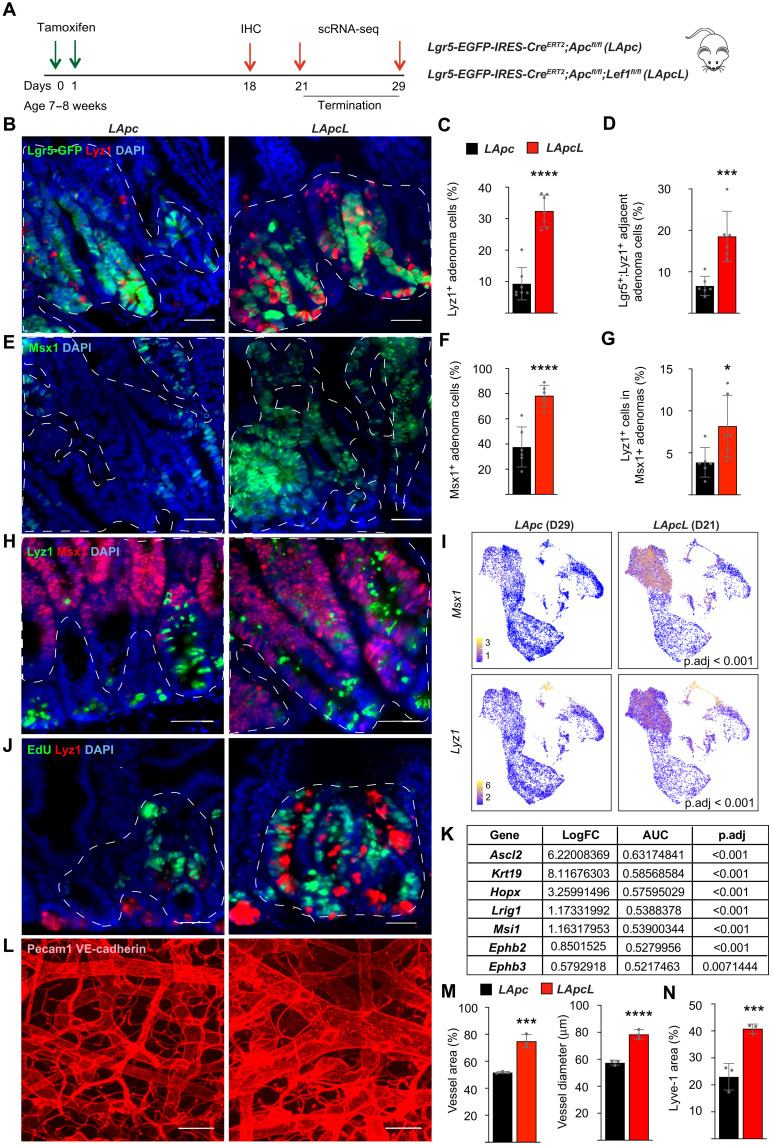
Fig. 5. Lef1 deletion increases the number of ectopic crypts in Apc-mutant adenomas.
(A) Schematic of the experiment. (B to D) Lgr5-GFP and Lyz1 immunostaining, quantification of the percentage of (C) Lyz1+ cells and (D) Lgr5-GFP;Lyz1+ doublets in LApc and LApcL adenomas. Scale bars, 50 μm. n = 6 per group, ***P < 0.005 and ****P < 0.001. (E and F) Immunostaining (E) and quantification (F) of the ectopic crypt marker Msx1. Scale bars, 50 μm. n = 6 per group, ****P < 0.001. (G and H) Immunostaining (H) and quantification (G) of Lyz1+ cells in Msx1+ adenomas. Scale bar 50 μm. n = 6 per group, *P < 0.01. (I) UMAP visualization of the expression of Msx1 and Lyz1 in the scRNA-seqs from LApc and LApcL mice. (J) EdU and Lyz1 immunostaining. (K) Differential gene expression analysis of Ascl2, Krt19, Hopx, Lrig1, Msi1, Ephb2, and Ephb3 in LApcL versus LApc adenoma cluster. (L and M) Immunofluorescent (L) staining and quantification (M) of Pecam1;VE-cadherin+ vessel area and diameter in LApc and LApcL intestines 21 days after tamoxifen. Scale bars, 50 μm. n = 3 per group, ***P < 0.005 and ****P < 0.001. (N) Quantification of Lyve-1 immunofluorescent staining in LApc and LApcL intestines 21 days after tamoxifen. n = 3 per group, ***P < 0.005. Data are shown as means ± SD. The dashed lines indicate nuclear β-catenin+ adenoma areas.

