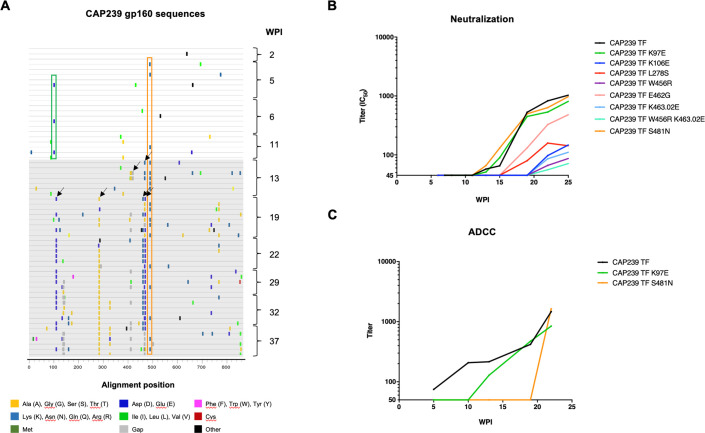
Fig 1. Escape from ADCC and neutralizing antibody responses in CAP239.
(A) Highlighter amino acid plot comparing 61 single genome env sequences, generated from 10 time-points over eight months of infection, to the T/F sequence (top line). The two sites that were evolved prior to nAb responses, and occurred in multiple sequences, are shown as boxes: K97E (green box), and S481N (orange box); and the eight sites/combination sites that evolved after nAb responses, and occurred in multiple sequences, are as arrows (K97E, K106E, L278S, W456R, E462G, K463.02E, S481N, W456R K463.02E). (B) Neutralization titers (IC50) of longitudinal autologous plasma evaluated against pseudoviruses: CAP239 T/F env, and 10 CAP239 T/F with sites/combination sites which evolved after nAb responses developed. (C) ADCC antibody titers against infected targets cells in the Luciferase ADCC assay. Cells were infected with T/F virus, as well as the T/F virus with K97E or S481N incorporated. These viruses were used to infect CEM.NKRCCR5 as targets and utilized with donor PBMCs as effectors. WPI indicates weeks post infection. Points on ADCC and neutralisation plots indicate the mean of ≥three independent experiments.

