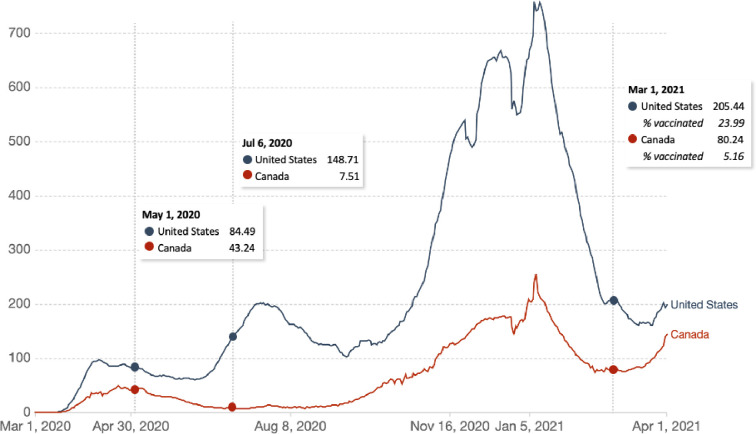
Fig 1. Daily new confirmed COVID-19 cases per million people (rolling 7-day average) in the United States and Canada.
The survey data was collected from May 1 to 4, 2020 (n = 1019), July 6 to 10 (n = 3923), and February 12 to March 4, 2021 (n = 2736). Source: COVID-19 Data Repository from the Center for Systems Science and Engineering (CSSE) at Johns Hopkins University via Our World in Data [8].

