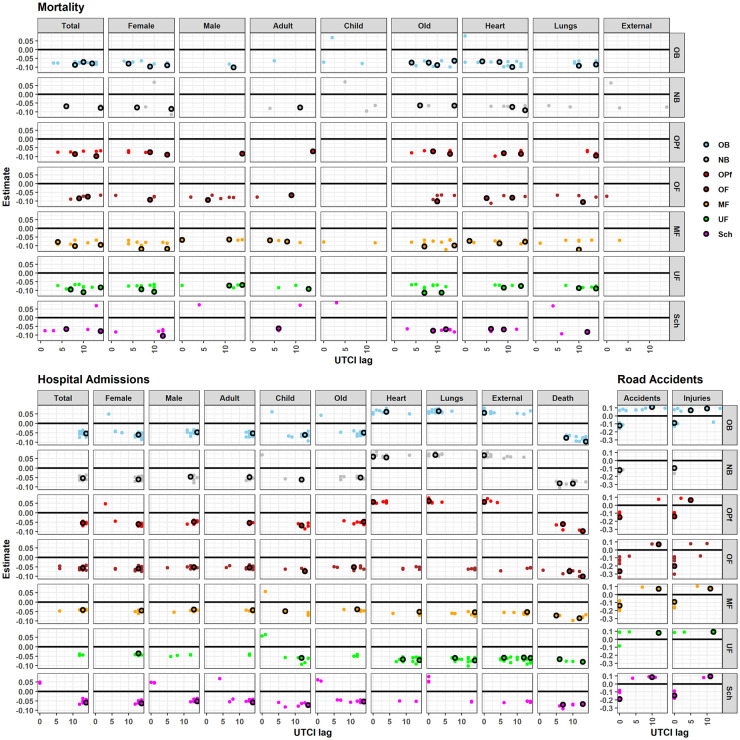
Fig 4. Winter UTCI effect.
Winter UTCI effect on daily cases of mortality, hospital admissions, and road accidents for each subgroup and district. The horizontal axis represents the lag in days, and the vertical axis represents the effect estimate. It is expressed in proportion of the standard deviations of daily number of cases within the corresponding subgroup when UTCI changes by one standard deviation of its daily value. The black circles represent those effects for each region. The colored dots represent those effects for districts within the region. The absence of points indicates that the effect of UTCI was not significant for a particular lag in the corresponding model.

