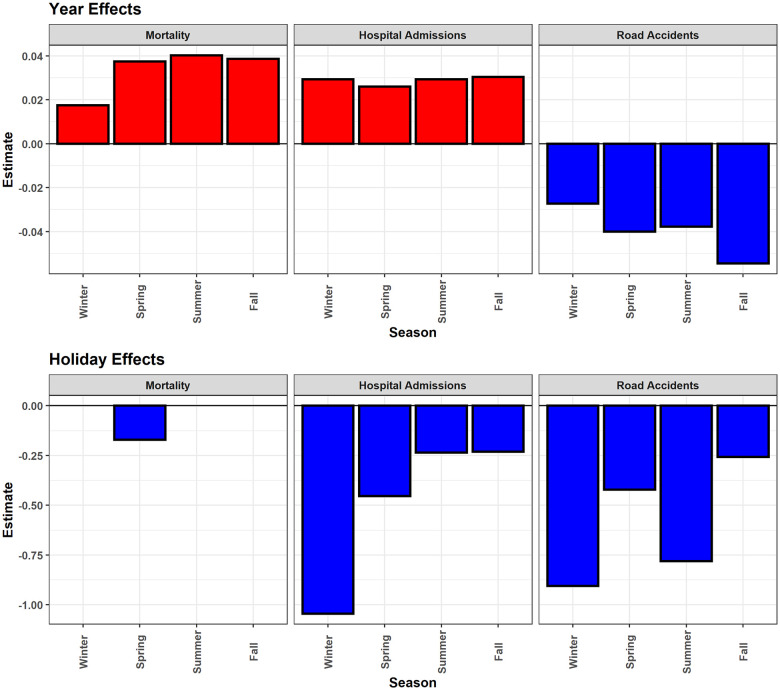
Fig 6. Year and holiday effects.
Year and holiday effects on daily mortality, hospital admissions, and road accidents for each season, expressed as a proportion of the standard deviation of the respective daily number of cases within Bavaria. The absence of a column means that the effect of the year or holiday was not significant in the corresponding model. Explanatory example: For winter hospital admissions, the sd is 3143.5 (see Table 1), and the year effect for Bavaria is 0.02933. This indicates an increase in daily hospital admissions by 0.02933*3143.5 = 92.2 every year.

