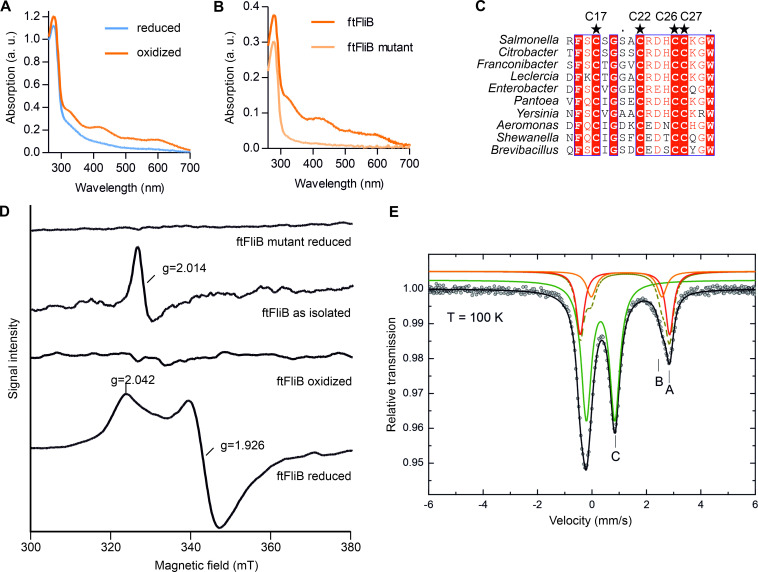
Fig 2. Spectroscopic characterization of FliB [4Fe-4S] cluster.
(A) UV-vis absorption spectra of oxidized (as purified) and dithionite reduced ftFliB (~160 μM, reconstituted protein). (B) UV-vis absorption spectra of reconstituted wild type (ftFliB) and ftFliB C17A C22A C26A C27A mutant (ftFliB mutant, ~50 μM). (C) Alignments of FliB N-terminal amino acid sequences from multiple genera (S2 Fig). Conserved cysteines are marked with stars. (D) X-band EPR spectra of ftFliB at T = 10 K treated with dithionite under strictly anaerobic condition (ftFliB reduced); ftFliB treated without dithionite and exposed to oxygen for long (ftFliB oxidized); ftFliB isolated under reducing condition but was shortly exposed to oxygen (ftFliB as isolated); and ftFliB mutant treated with dithionite anaerobically (ftFliB mutant reduced). (E) Zero-field 57Fe Mössbauer spectrum of anaerobic reconstituted 57Fe enriched ftFliB, recorded at T = 100 K. Symbols: Experimental data. Lines: Fit with doublets of Lorentzian lines. The coloured solid lines illustrate the corresponding sub-spectra (A, B and C) of the fit, while the black line represents the superposition of these components A, B and C. The parameters of the fit are summarized in Table 1.

