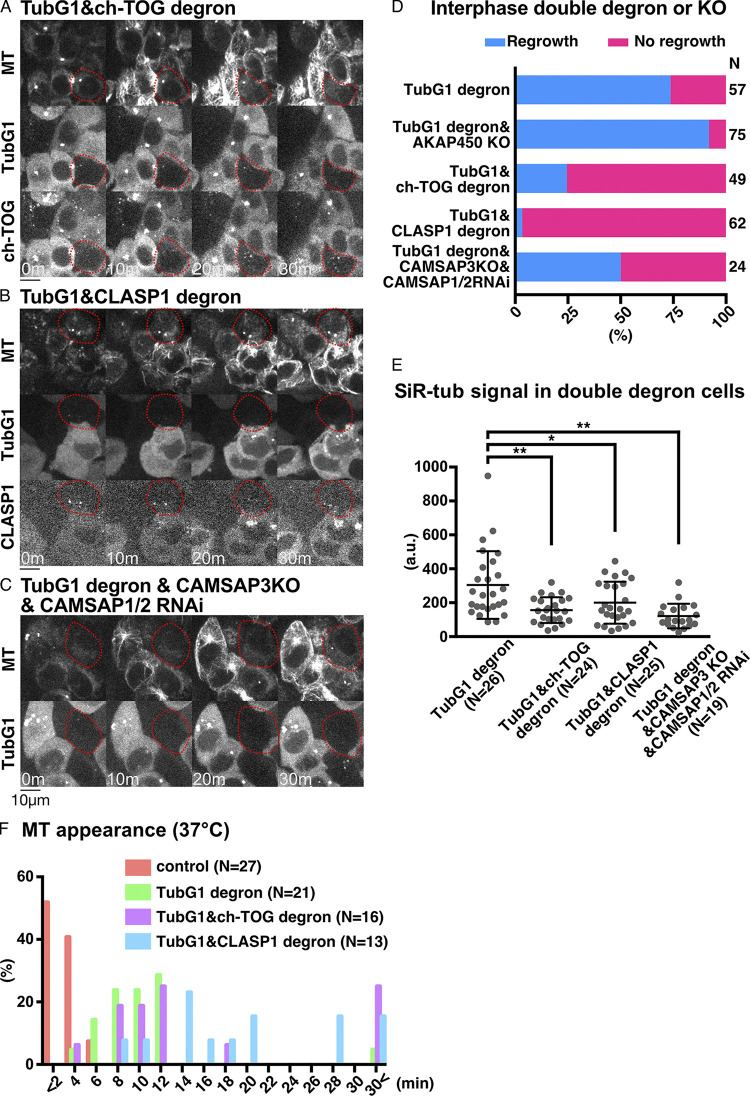
Figure 6.
CLASP1 promotes γ-tubulin–independent MT generation. (A–C) Suppression of MT regrowth by double depletion of γ-tubulin and ch-TOG (A), CLASP1 (B), or CAMSAP1/2 (C, CAMSAP3 KO background) at 25°C. Depleted cells are marked in red circles, whereas the surrounding cells with γ-tubulin and MAPs acted as the internal controls. Scale bars, 10 µm. (D and E) Frequency of MT appearance (D) and MT intensity (E) in the indicated lines (25°C, 30 min after nocodazole washout). Means and SDs are as follows (from left to right): 304 ± 200, 156 ± 76, 200 ± 124, and 121 ± 72. The one-way ANOVA detected significant differences between groups (F = 8.437, P < 0.0001). The post-hoc test was performed by Tukey’s test (P = 0.0009, P = 0.0313, and P < 0.0001). *, P < 0.05; **, P < 0.01. (F) Time of MT appearance after nocodazole washout at 37°C in the indicated lines. n values are listed within each graph.

