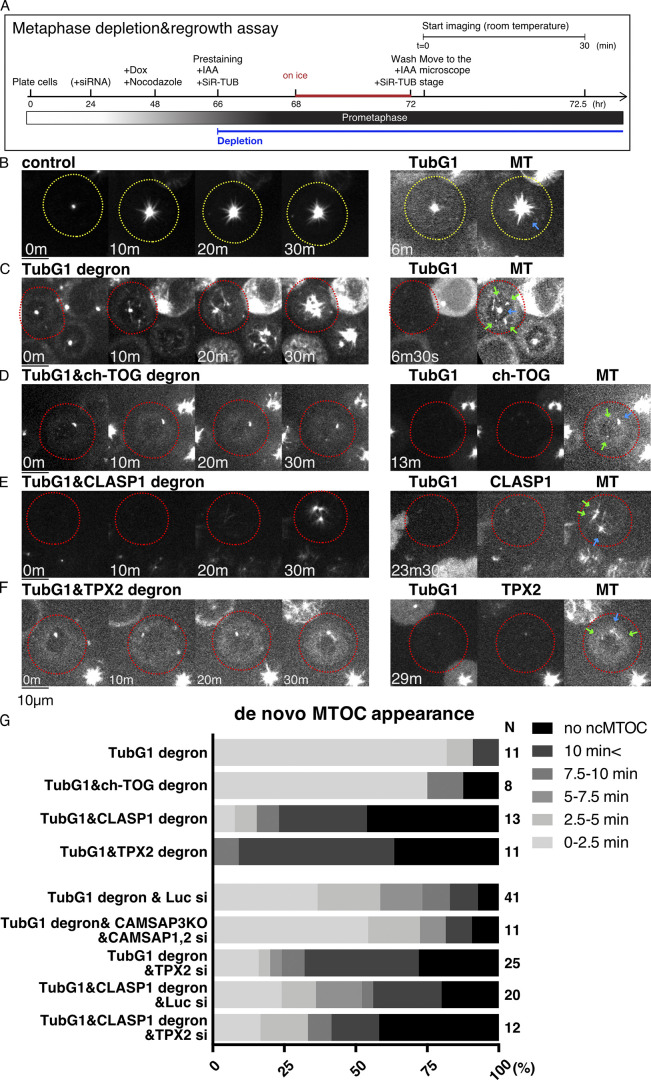
Figure 7.
CLASP1 and TPX2 promote γ-tubulin–independent MTOC formation in mitosis. (A) Flowchart of MT regrowth assay in mitosis. (B–F) MT regrowth after drug washout in the indicated cell lines. The cells with undetectable levels of γ-tubulin and MAPs are marked in red circles, whereas the control cells are marked in yellow. Blue arrows in the right panel indicate the centriole, which retains MTs even after cold/drug treatment, whereas green arrows indicate ncMTOCs. Scale bars, 10 µm. (G) Timing of ncMTOC formation after nocodazole washout in the indicated cell lines. n values are listed within each graph.

