Figure 8.
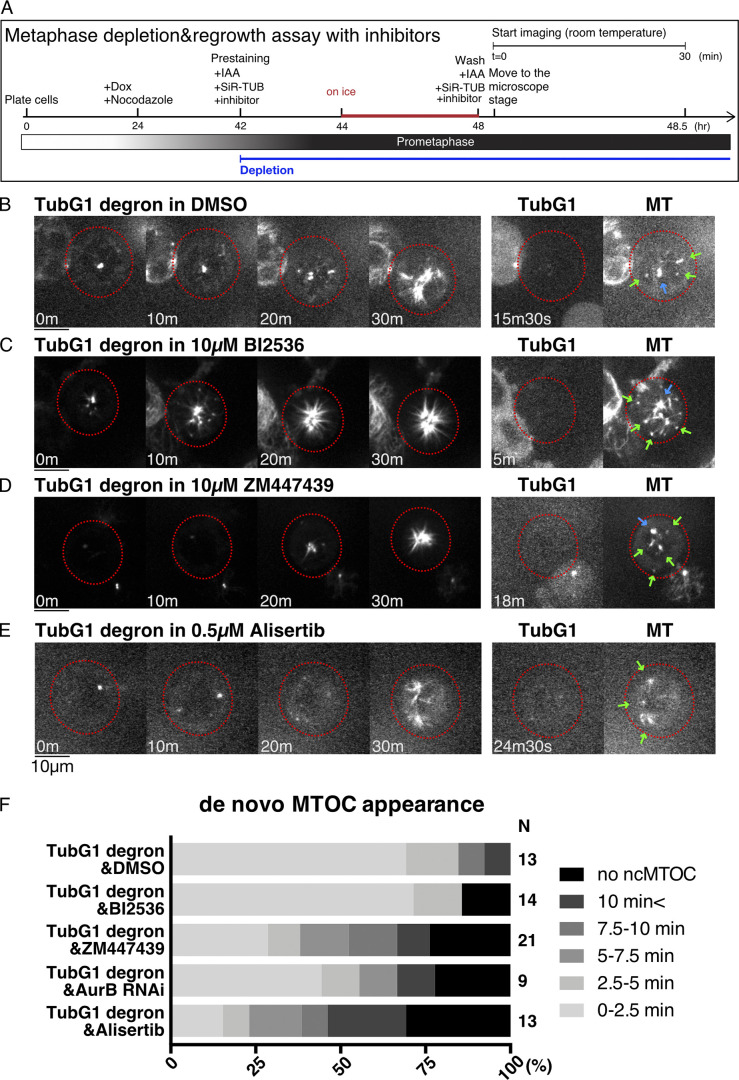
Aurora kinases contribute to γ-tubulin-independent MTOC formation in mitosis. (A) Flowchart of MT depolymerization-regrowth assay in prometaphase combined with AID and drug treatment. (B–E) MT regrowth after drug washout in the indicated cell lines and treatment. The cells with undetectable levels of γ-tubulin are marked in red circles. Blue arrows in the right panel indicate the centriole, which retains MTs even after cold/drug treatment, whereas green arrows indicate noncentriolar MTOCs. Scale bars, 10 µm. (F) Timing of ncMTOC formation after nocodazole washout in the indicated cell treatment. n values are listed within each graph.

