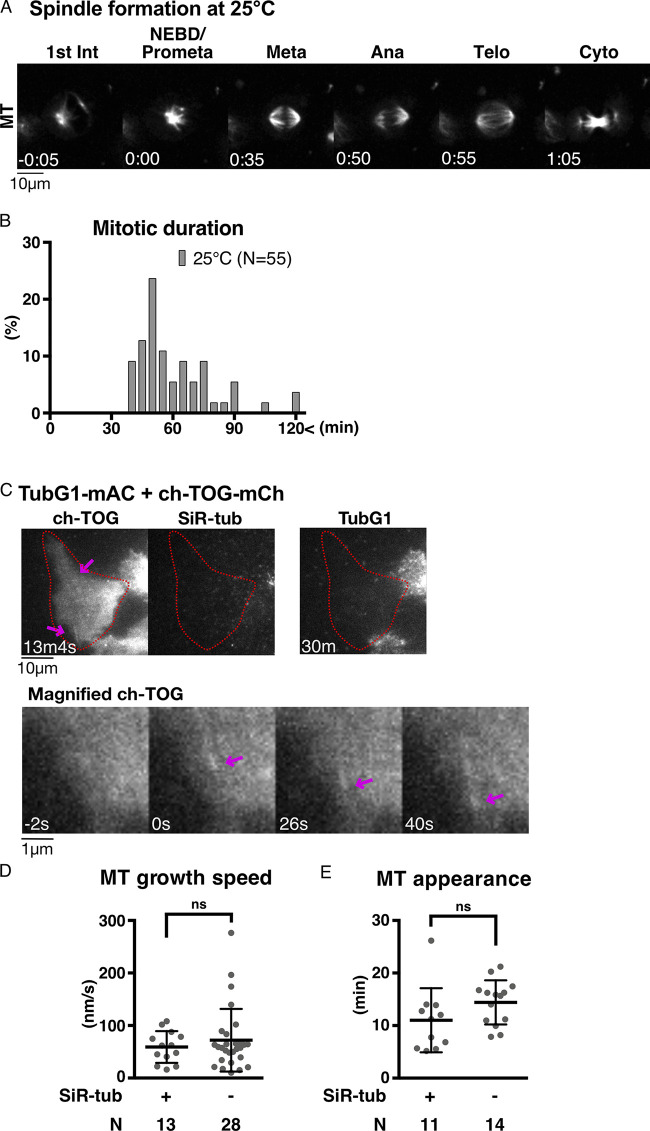
Figure S2.
Validation of MT regrowth assay. (A) Mitosis of HCT116 cell line at 25°C. Time 0 corresponds to NEBD. (B) Mitotic duration at 25°C (NEBD to anaphase onset). (C) MT nucleation in the absence of γ-tubulin, without SiR-tubulin staining, in interphase. The cells with undetectable levels of γ-tubulin are marked in red circles. MTs were visualized using ch-TOG-mCherry (arrows). (D and E) MT dynamics of γ-tubulin–depleted cells based on ch-TOG-mCherry signals with or without SiR-tubulin staining. MT growth rate was determined based on kymographs of ch-TOG-mCherry. Data are presented as mean ± SD with SiR-tubulin (59 ± 30 nm/s, 11 ± 6 min) and without SiR-tubulin (72 ± 60 nm/s, 14 ± 4 min). Statistical evaluation was performed using unpaired t test with Welch’s correction (P = 0.3644 and P = 0.1315). n values are listed within each graph.

