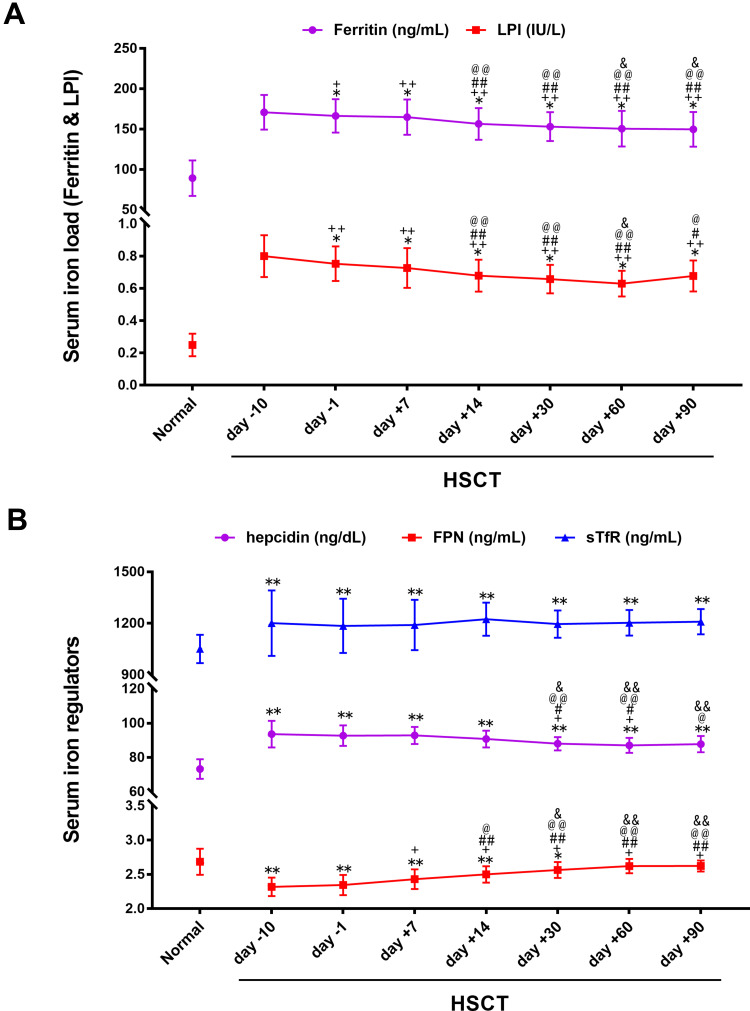
Figure 6.
Comparison of iron load and its regulator during HSCT process. The serum level of iron load indexes, ferritin and labile plasma iron (LPI) (A), as well as iron-absorbing regulators, hepcidin and soluble transferrin receptor (sTfR) (B) were detected. Data are presented as mean ± SD; *P < 0.05, **P < 0.01 (as compared with the normal population);+P < 0.05, and ++P < 0.01 (as compared with −10d); #P < 0.05, ##P < 0.01 (as compared with −1d); @P < 0.05, @@P < 0.01 (as compared with +7d); &P < 0.05, and &&P < 0.01 (as compared with +14d).

