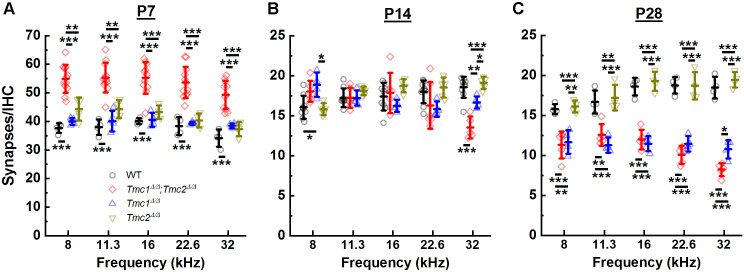
Figure 3. Synapse counts were elevated at postnatal day 7 (P7) in the absence of both Tmc1 and Tmc2 and diminished at P28 in the absence of Tmc1 and Tmc2 or Tmc1 alone.
(A–C) The mean number of synapses/inner hair cell (IHC) was calculated for each frequency region. Data from wild-type (WT) (black), Tmc1Δ/Δ;Tmc2Δ/Δ (red), Tmc1Δ/Δ (blue), and Tmc2Δ/Δ (dark yellow) groups are shown. Individual points represent counts from one mouse. Temporal changes in synapse counts differed by genotype (two-way ANOVA; p < 0.001 based on two-way interaction between genotype and timepoints for all frequencies; Supplementary file 3A). However, genotype-specific trajectories of synaptic development did not vary by frequency (three-way ANOVA; p = 0.73 based on three-way interaction between group, time, frequency; Supplementary file 3A). Bolded lines depict mean ± SD. Black horizontal bars and asterisks represent statistically significant differences between group means (multiple pairwise comparisons, *p < 0.05, **p < 0.01, ***p < 0.001; p values are listed in Supplementary file 2A-C). Number of cochleas: 4–9 WT, 5–12 Tmc1Δ/Δ;Tmc2Δ/Δ, 4 Tmc1Δ/Δ, 4–5 Tmc2Δ/Δ.

